Volume Indicators

Volume quantifies the number of shares traded in a certain period of time, as such volume can return information about the degree of activity and liquidity of a security.
Volume indicators are indicators that process historical volume in their calculations, but note that this is not always the case, indicators such as the volume weighted moving average (VWMA) or money flow index (MFI) are not considered volume indicators. Depending on their design they can be lagging or leading.
Some Volume Indicators
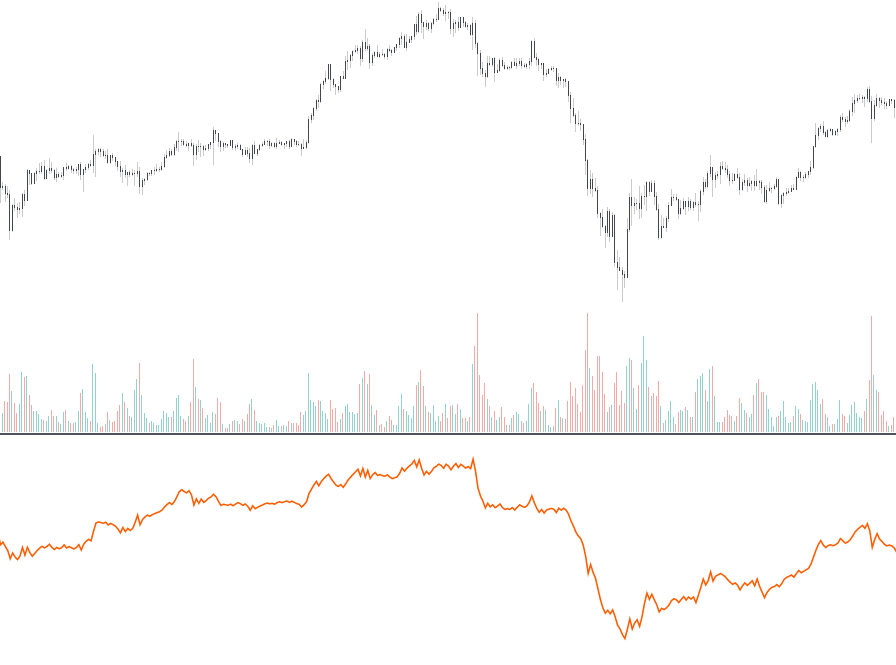
Like volatility indicators, the number of volume indicators is inferior to trend or momentum indicators, yet some of them have seen an high popularity, this is the case of the price volume trend indicator (PVT), which is based on the cumulative sum between price change weighted by the current volume, this allows to get a different representation of the price where variations with low volume are filtered out.
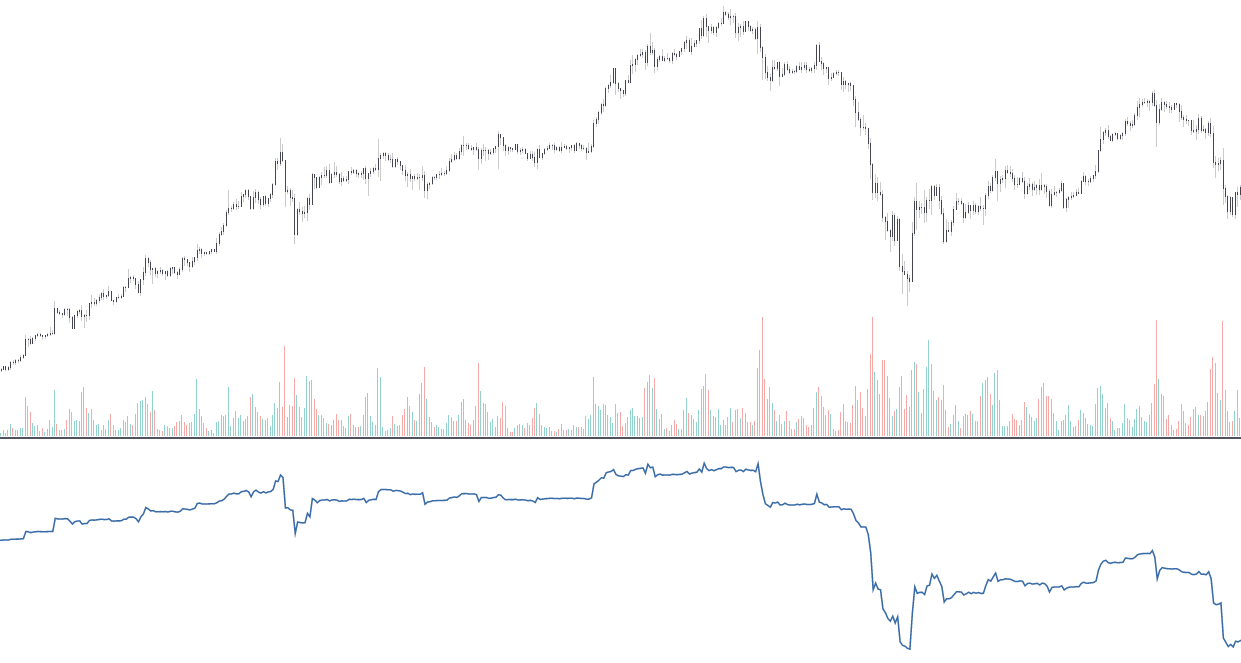
A similar indicator include the on balance volume (OBV) who's calculation is extremely similar to the one of the PVT but use the sign of the price changes instead.
Other volume indicators include the accumulation/distribution index, ease of movement, and Elder force index amongst others.
Volume Profile
The volume profile is a useful tool that shows the distribution of volume over price.
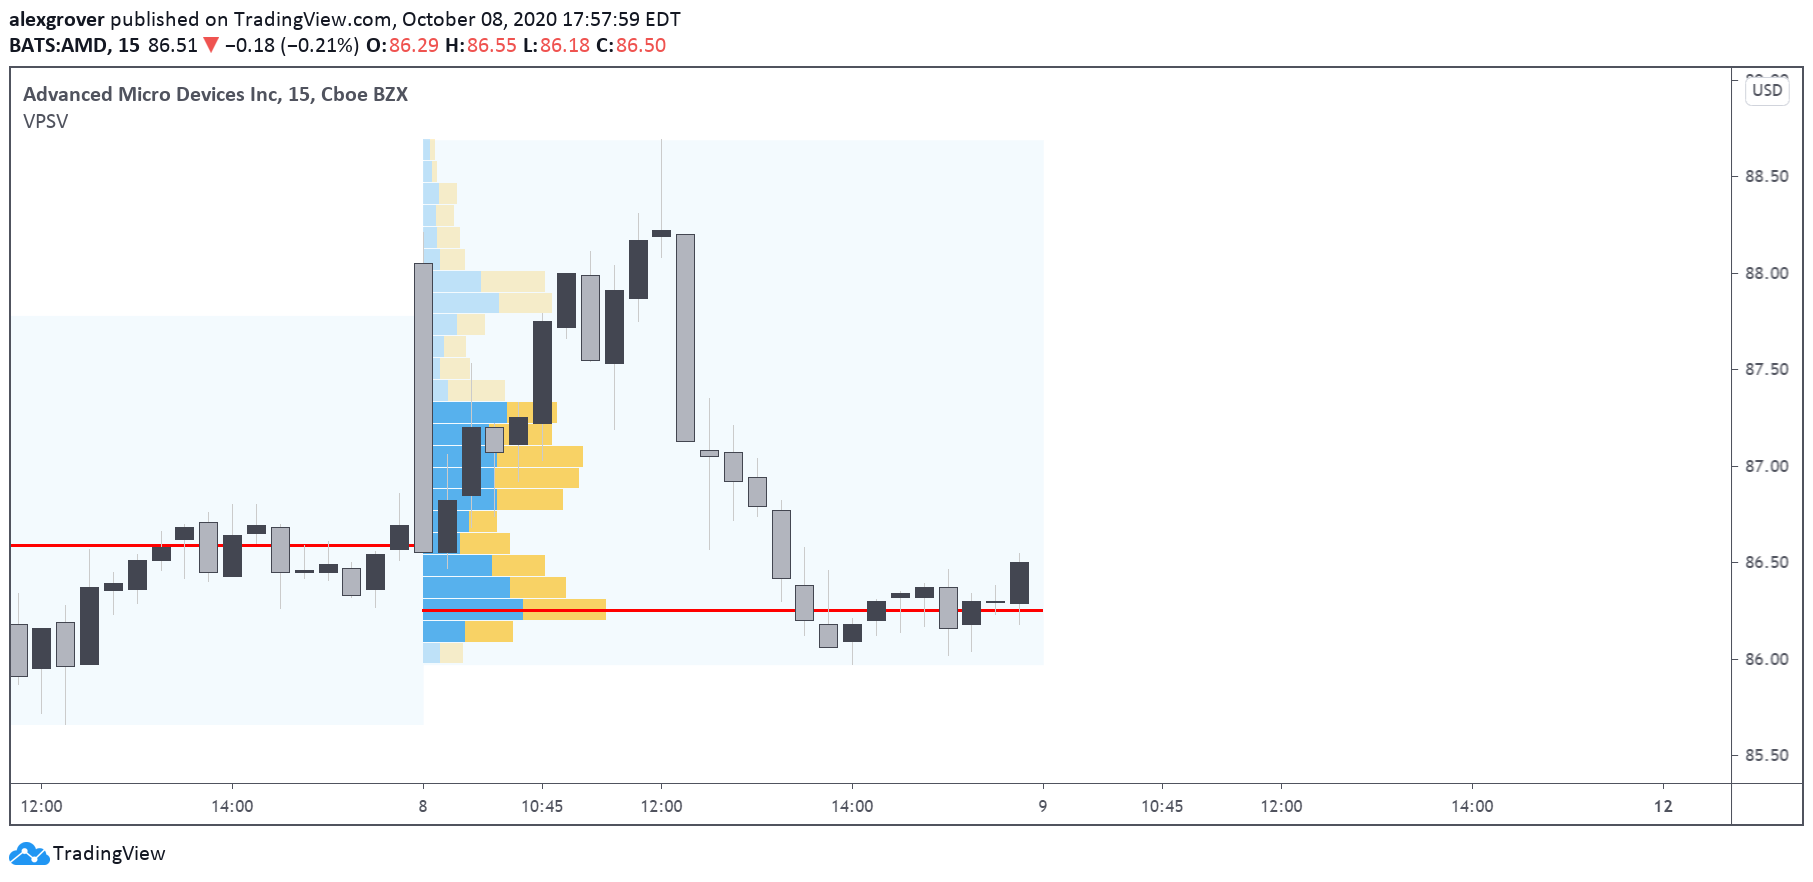
The red line is defined as the point of control and represents the price level that accumulated most volume, it is frequent to see it in zones where price is relatively stationary.