Volatility Indicators

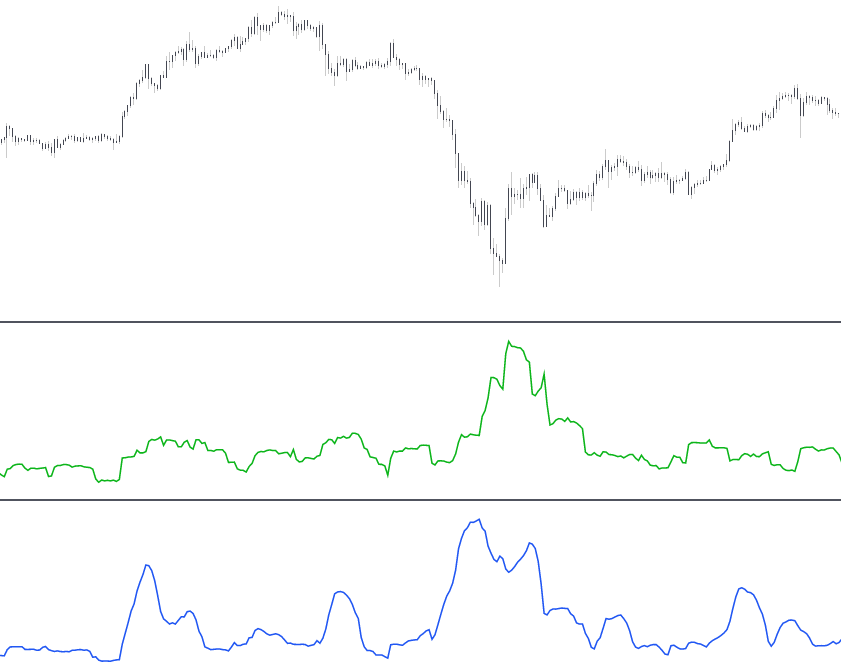
Volatility indicators measure the degree of variations of the closing prices, and don’t give information about the direction its taking or might take, as such volatility indicators can be useful to quantify risk and can help traders adjust their position based on their risk aversion. Most volatility indicators are lagging indicators.
While it is not common to see volatility indicators already applied on a trader chart we can still see their applications on a large numbers of well known technical indicators such as the Bollinger Bands or Supertrend.
Some Volatility Indicators
Most well know volatility indicators include the rolling standard deviation indicator (STDEV) and average true range (ATR) developed by Wilder.
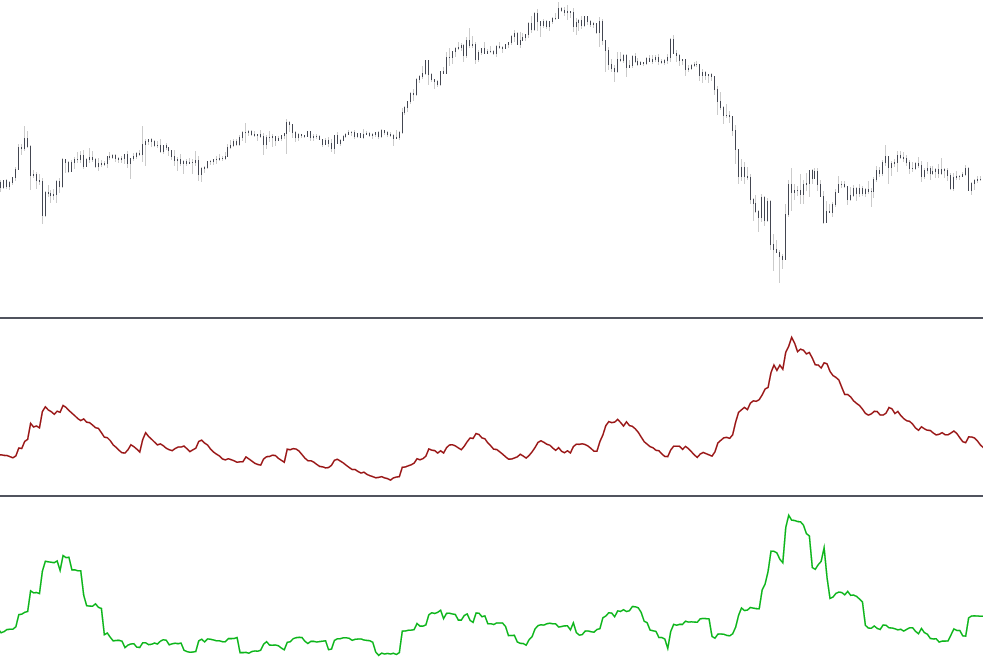
Some traders use the standard deviation of prices changes to calculate volatility while others use the standard deviation of closing prices.