Supports & Resistances
![Support and resistance [1]](/img/technical-analysis/support-resistance/image394.png)
The support and resistance methodology is one of the oldest and most well known in technical analysis. Support and resistances consist of lines where the price regularly bounce, when the price reaches a resistance, it bounces back toward the support, and when it reaches the support, it bounces back toward the resistance.
Support and resistances can be manually drawn or be determined by a technical indicator. In case they are manually drawn, it is common to connect a recent swing high/low with a past swing high/low and see if the resistance/support was significant.
Breakouts
When the price cross under a support, or cross over a resistance, we say that price broke its support/resistance, this often suggest the start of a strong trend, with an up-trend occurring when the price breaks its resistance, and a strong down-trend occurring when the price breaks its support.
Change In Polarity
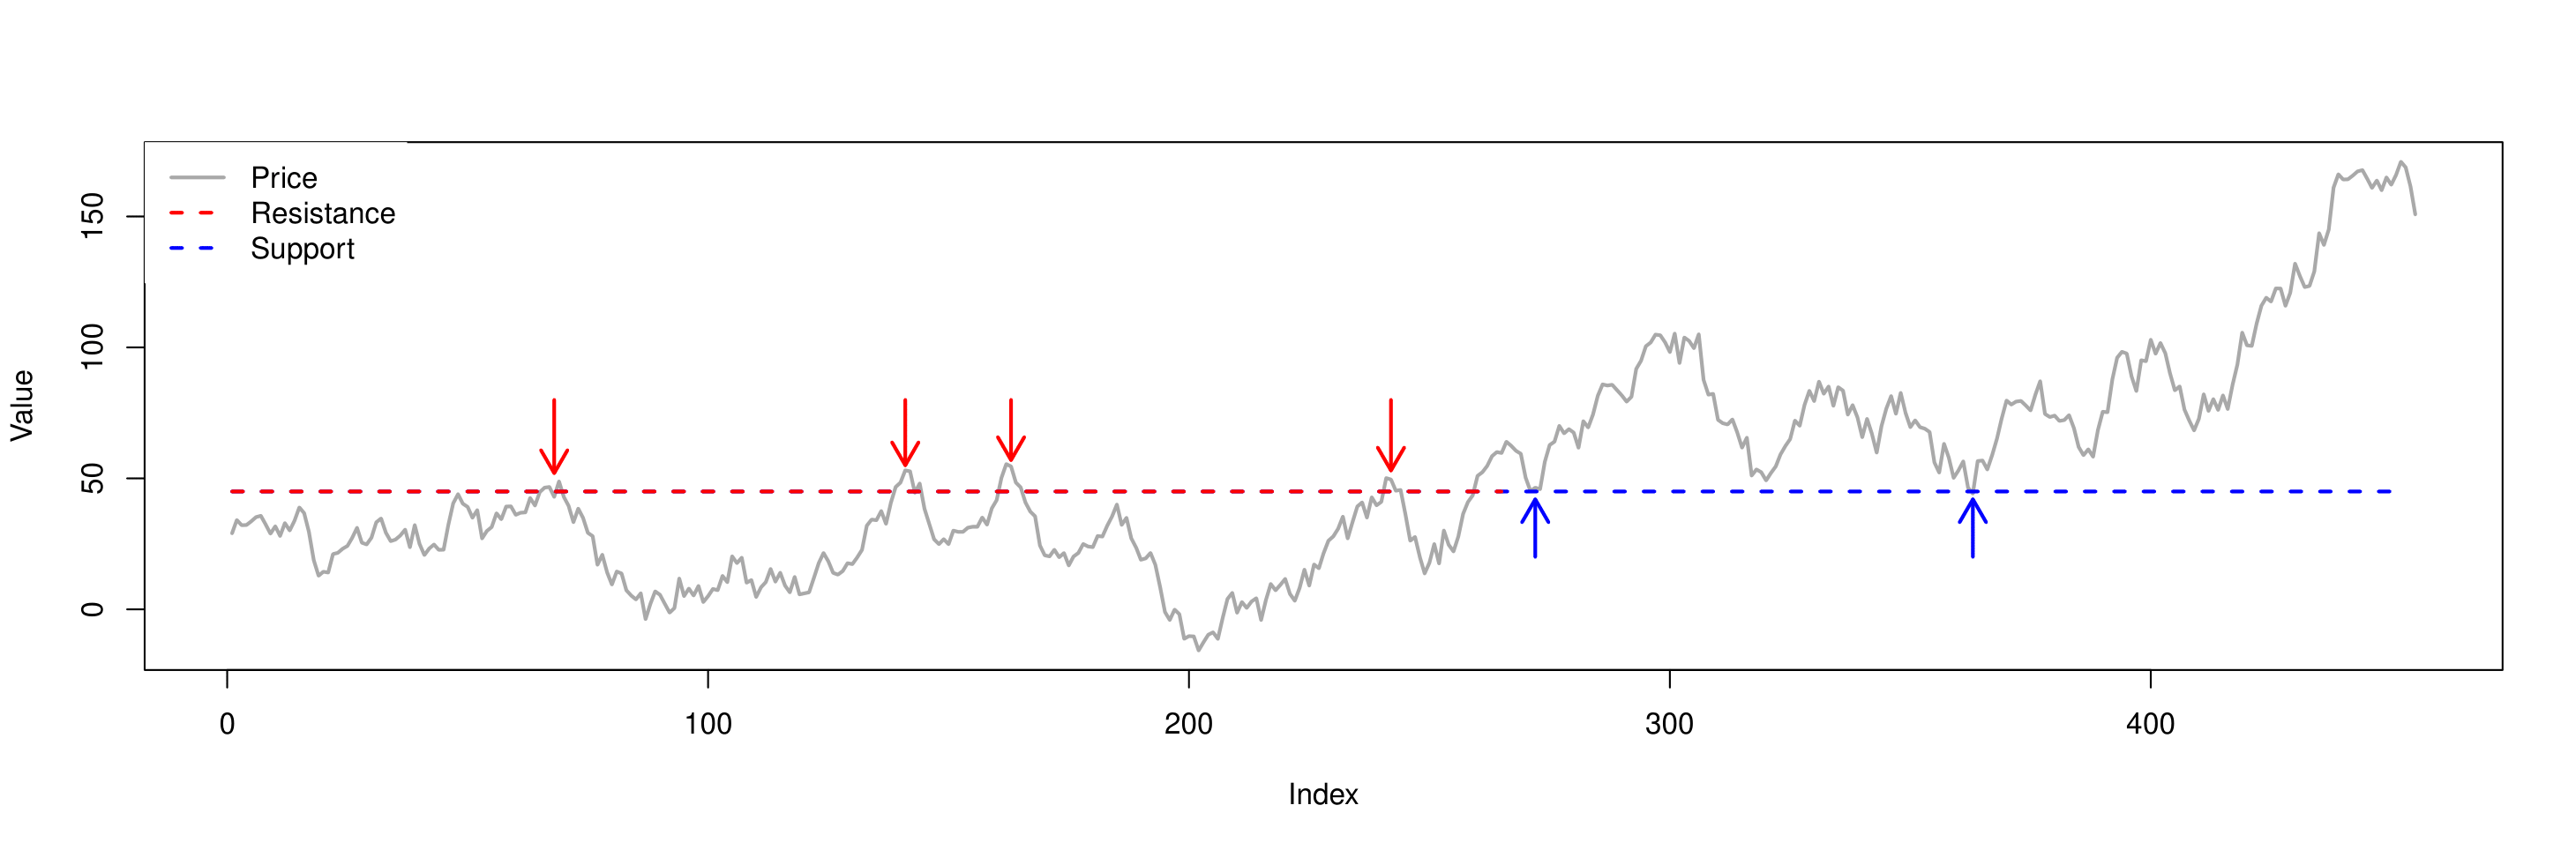
Sometimes an old support can become a new resistance, and vice versa, when this occurs we say that there has been a change in polarity.
Support & Resistances With Lux Algo
Lux Algo Premium allows you to automatically plot a wide variety of support and resistance on your chart. These can be found within the Lux Algo SR & Pattern toolkit, see:
»Lux Algo SR & Patterns PremiumReferences
[1] Sattarov, Otabek, et al. "Recommending Cryptocurrency Trading Points with Deep Reinforcement Learning Approach." Applied Sciences 10.4 (2020): 1506.