Popular Strategies
This page covers some of the more basic and simple to follow strategies popular among Lux Algo users. These concepts will help users extract maximum potential from Lux Algo whilst providing education on basic trading theory such as confluence and trends.
Multi-timeframe strategy
Traders will often use multiple timeframes in order to confirm their trade or position. Using a lower timeframe to gain a higher resolution can be a great approach to pinpointing a cleaner entry to maximise profits. In the imagine below we show some generic price action on the 4 hour chart:
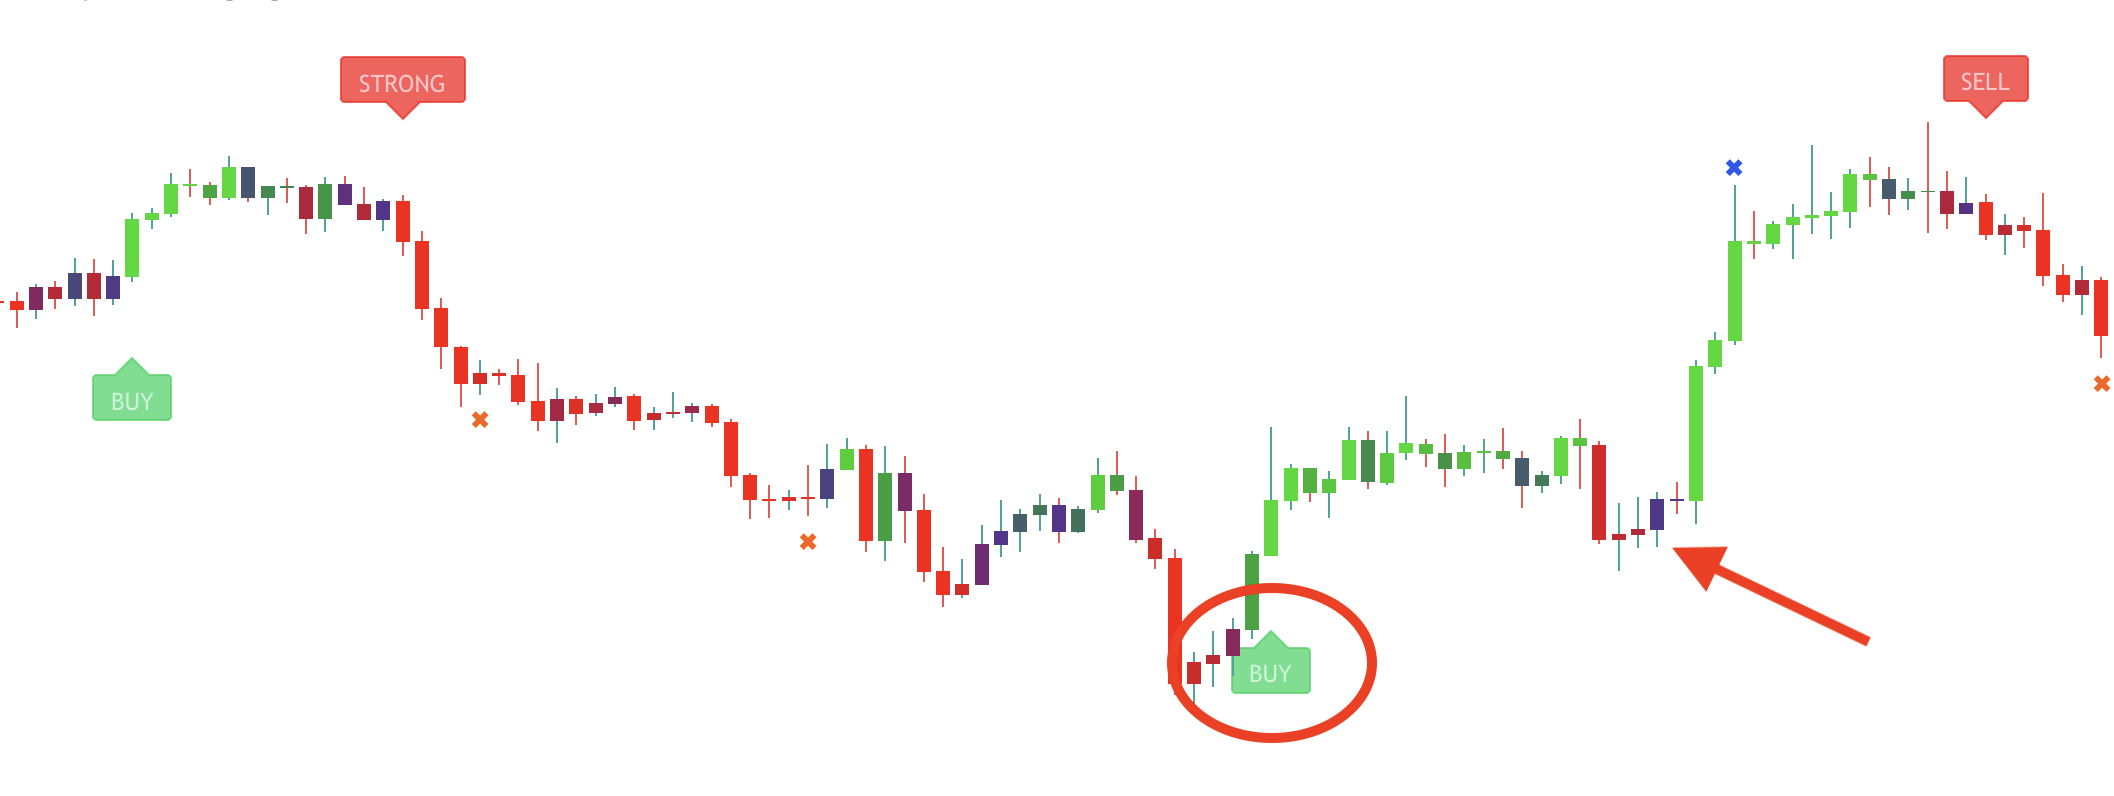
Highlighted with a red circle is a classic confirmation buy signal. This signal resulted in a small gain initially. However, soon after this signal we see a deep retracement pointed to by the red arrow. By going to lower timeframes it can provide a fantastic opportunity to find a great, cleaner entry for maximum gains. In the image below we show that retracement price action zoomed in on the 1h, lower timeframe:
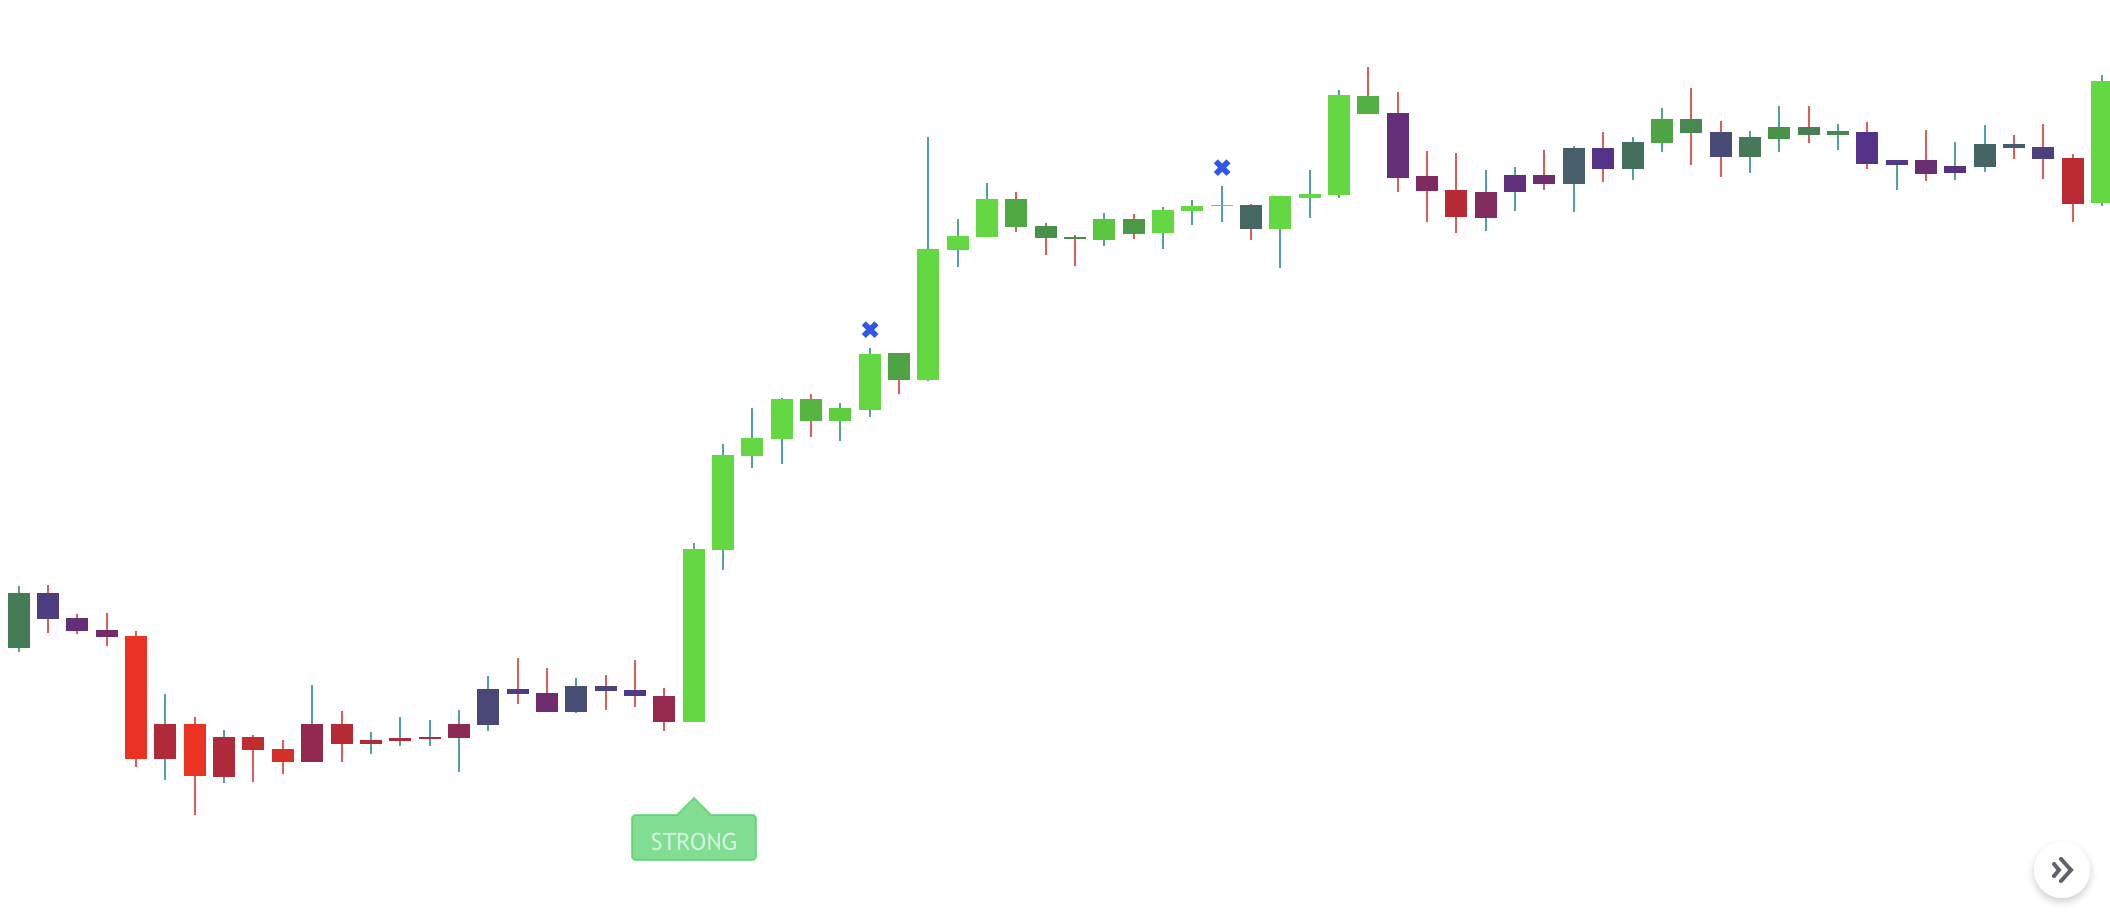
This strong buy signal indicates a large amount of buying pressure and a strong upward trend. This clearly provides a clearer, more precise entry for a trader. It’s important to notice the price action on the 4h chart formed a higher low indicating a possible market reversal adding to our confidence that this was the time to buy.
EQ Cloud Strategy
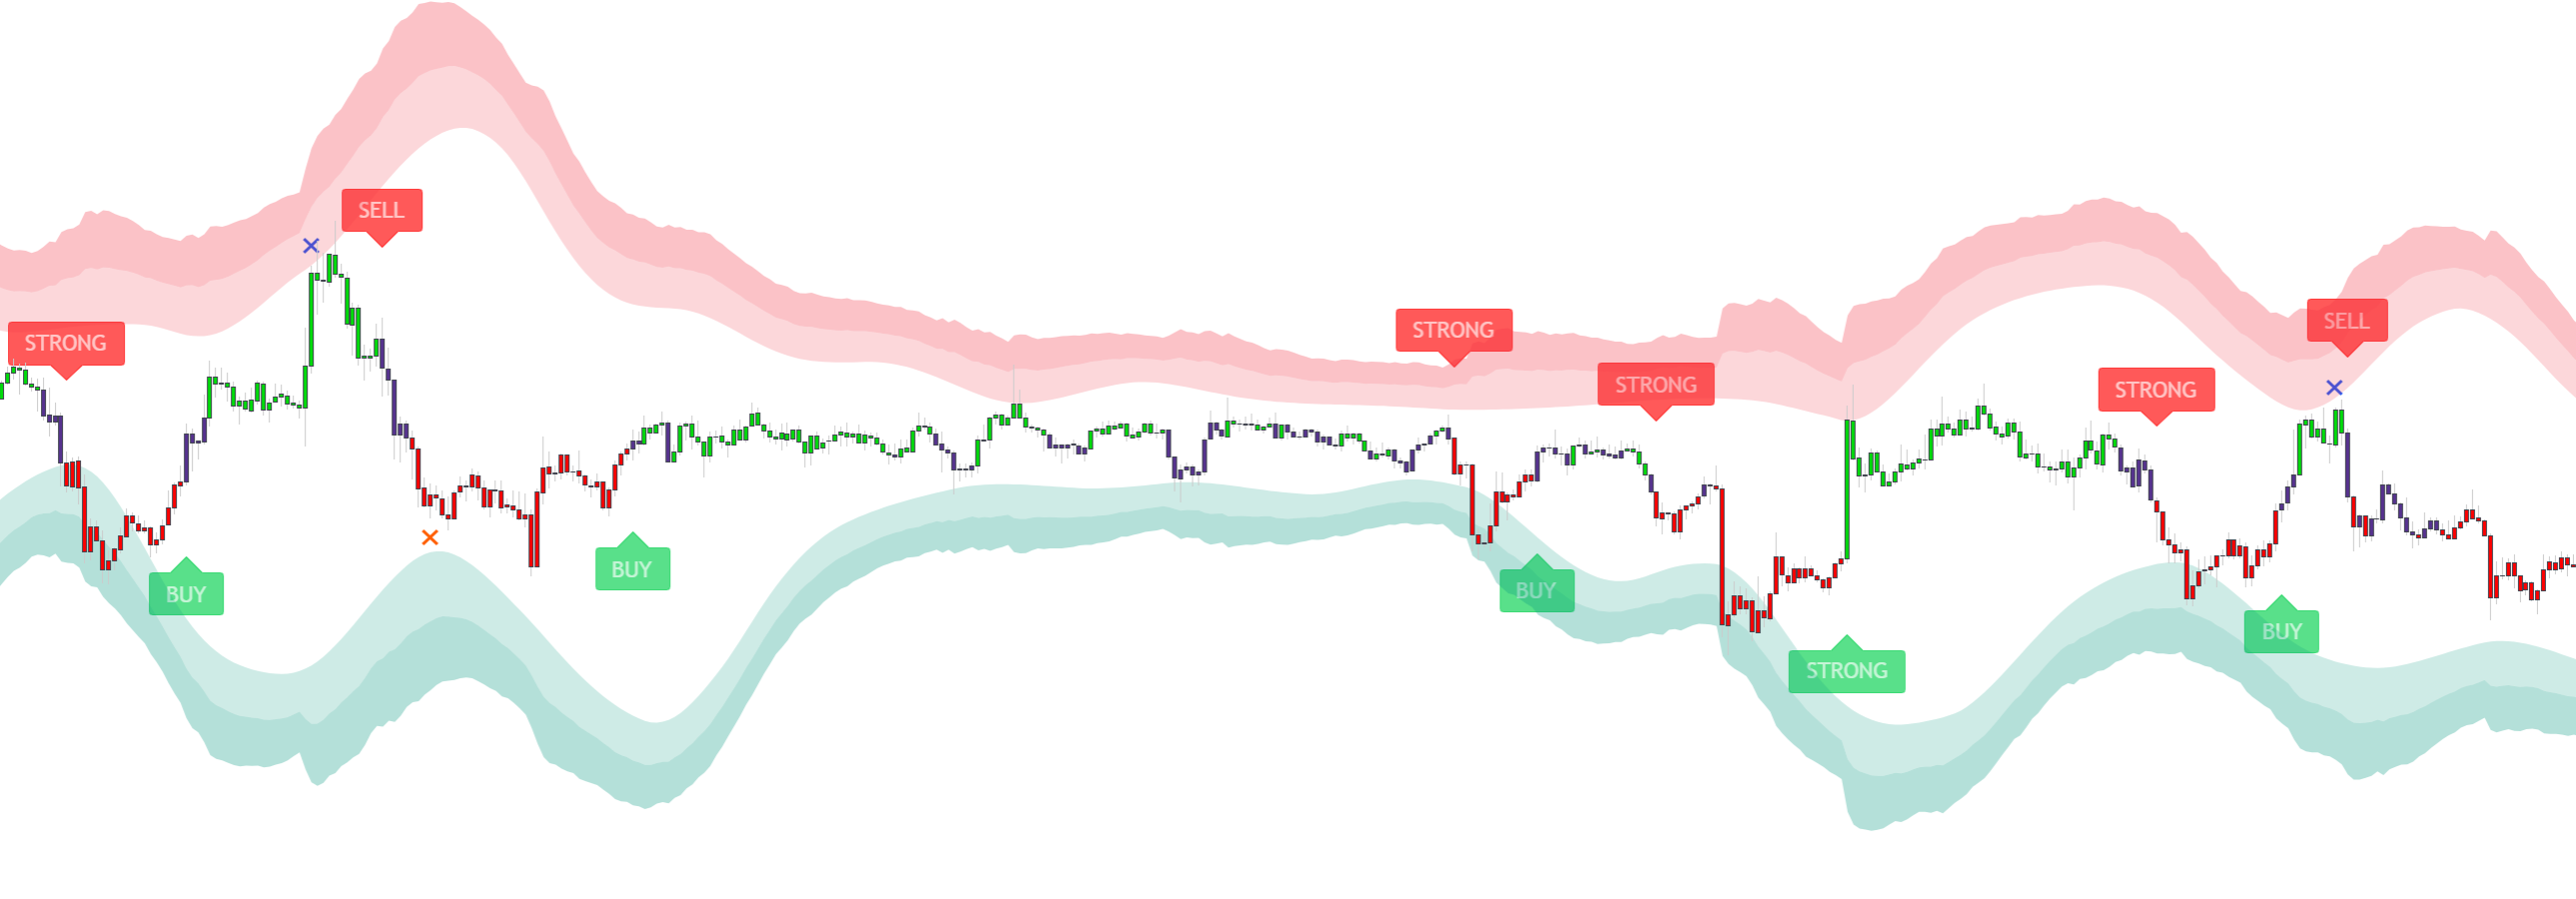
Using the EQ Cloud together with confirmation signals can be a simple and effective way to trade. In the figure below we have highlighted areas where the price found support or resistance on the EQ cloud with green and red arrows. The red arrows indicate areas where the price found resistance and the green arrows highlight areas where the price action found support.
When the price is at a resistance (as highlighted with red arrows) this suggests it’s a good time to sell or open a short position. When the price is at a support (as highlighted with green arrows) this suggests it’s a good time to buy or open a long position.
When we see the price action find resistance this suggests it is a good time to sell or short the market. This is made even more apparent when we see a sell signal following a bounce off the EQ cloud. This of course applies the opposite way. When we see the price find support and then a buy signal is produced this provides an extra level of confidence to the trader that a buy/long position is indeed the correct choice.
In the image above notice how price bounces off the EQ cloud are often resulting in a continuation of the trend.
Reversal Zones Strategy
Reversal Zones are one of Lux Algo’s most popular and iconic features. They behave exactly as you’d expect from the name. When the price enters a Reversal Zone it has a high probability of reversing making them fantastic for ranging markets which are notoriously tricky to trade. In the image below we show reversal zones in action with confirmation signals.
As you’ll notice in the image above the price action clearly and cleanly bounces off the Reversal Zones finding support or resistance. Although performing nicely here, confirmation signals are best used in a trending market. Thankfully, Lux Algo provides contrarian signals. These are best used in a ranging market and will produce signals going against the trend. These are shown in the image below.
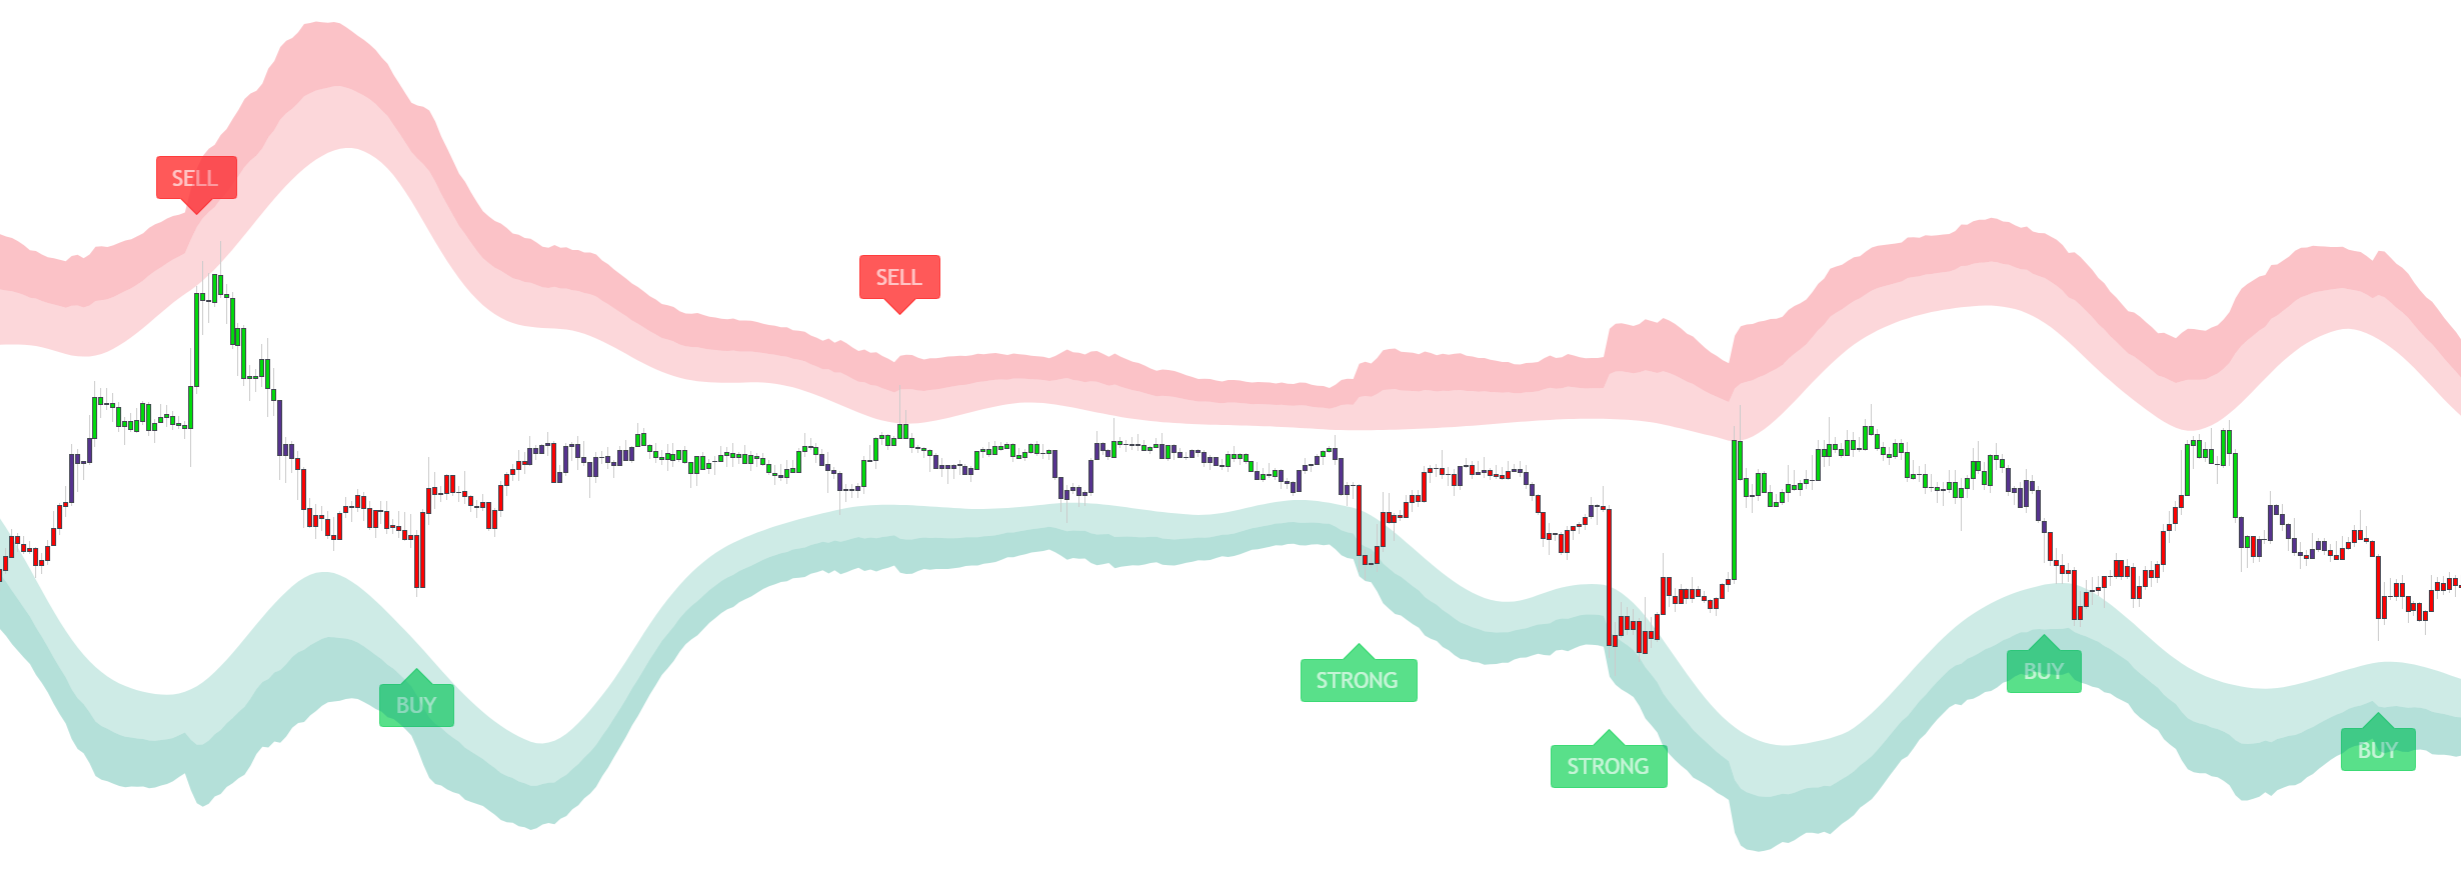
Contrarian Signals provide pinpoint signals aiming to target exact market tops and bottoms. These are great when used in confluence with Reversal Zones. As shown in the image above, when the price finds itself in a Reversal Zone along with a contrarian signal it provides a perfect buy/sell opportunity. Take the first Strong Sell signal. The price is clearly in the upper Reversal Zone indicating a strong area of resistance. We also have this Strong Sell signal suggesting the price will come down or reverse. This confluence or agreement between the two features means it’s a perfect opportunity to sell or short. When used together they are a powerful duo for navigating those tricky sideways markets.
Breakout Zone Strategy
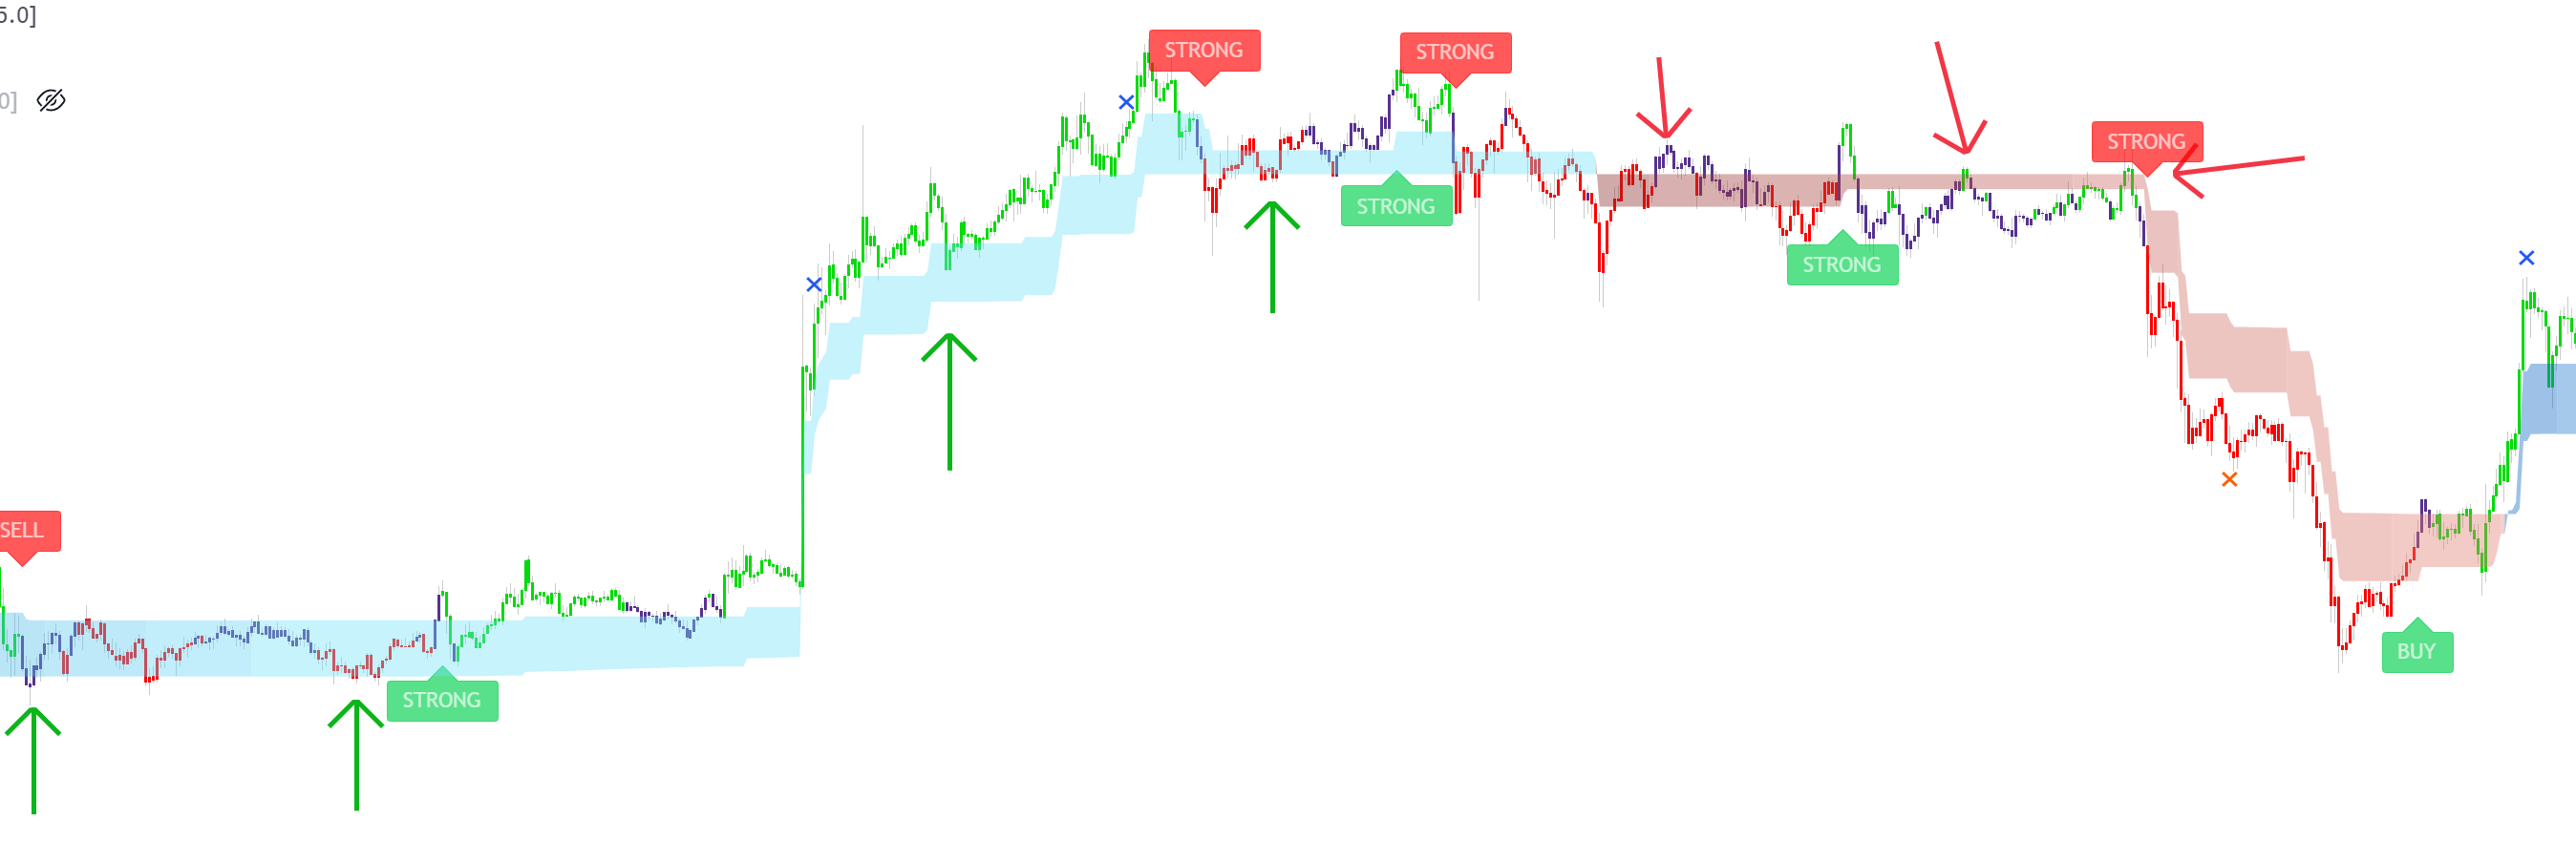
Breakout Zones are one of the most popular SR modes found within the Lux SR & Patterns Premium toolkit. They provide areas of supply and demand / support and resistance. When used with confirmation signals they provide real time levels that can be traded to filter false signals and pinpoint entries to once again obtain maximum profits. In the image below we see this in action.
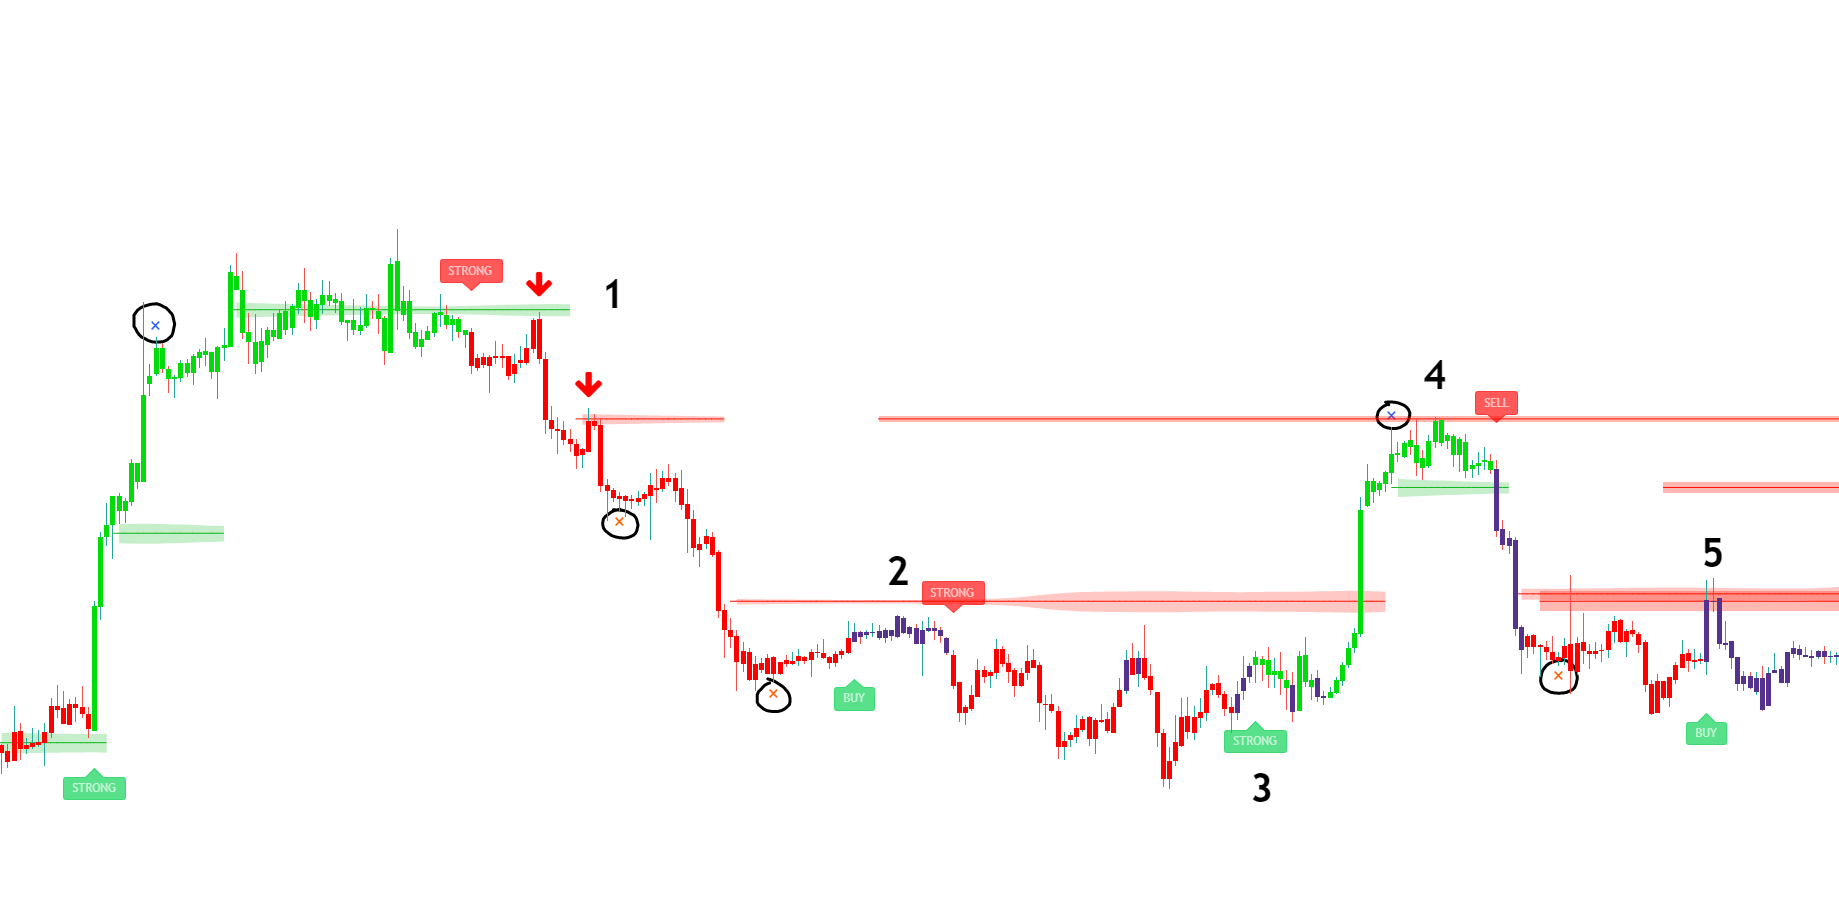
At location 1 in the figure above we see 2 red arrows after our strong sell signal. These are areas where the price retested the resistance. This provides the perfect re-entry points for the trade. The price cleanly bounces off of the 2 resistances and continues on its downward journey.
At location 2 we see a normal buy signal. The signal may not be of interest as it was not above a zone nor was it a strong buy signal.
At location 3 we see a strong buy signal which may be of more interest to the trader. We then see a sharp upwards move smashing through the zone.
At location 4 the price finds resistance at the previous zone. We also see an exit signal denoted with an x. This would be a great area to exit a previous long position.
At location 5 we see a buy signal that has not quite broken the zone and has found massive resistance at this area. This is likely a signal that should be avoided.
Confirmation exit signals are circled in black highlighting areas that are suitable for profit taking and attempt to help the trader exit at the peaks of trends. Features in SR mode can be very useful for helping users enter signals at better times.
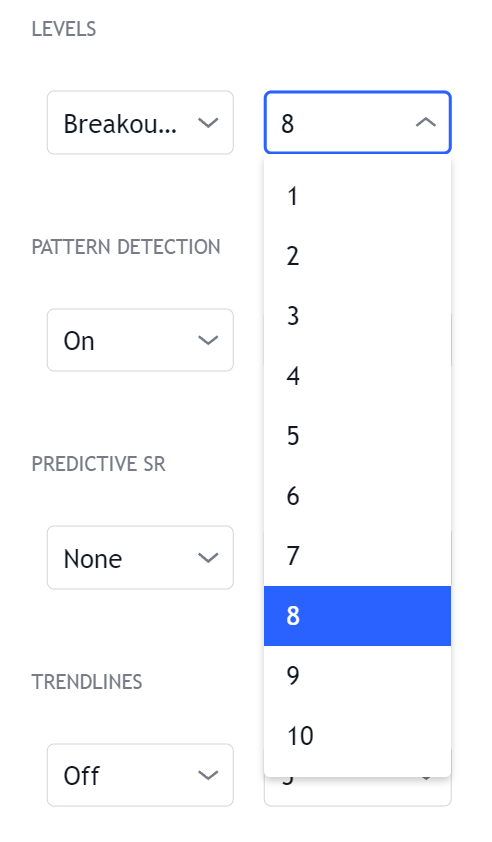
When using Breakout Zones, you can adjust the S/R Significance value to fit the zones better for trade setups if you are finding they do not initially fit your preference. A higher value like 8 may be more suitable in cleaning up redundant Breakout Zones.
Trend Catcher Strategy
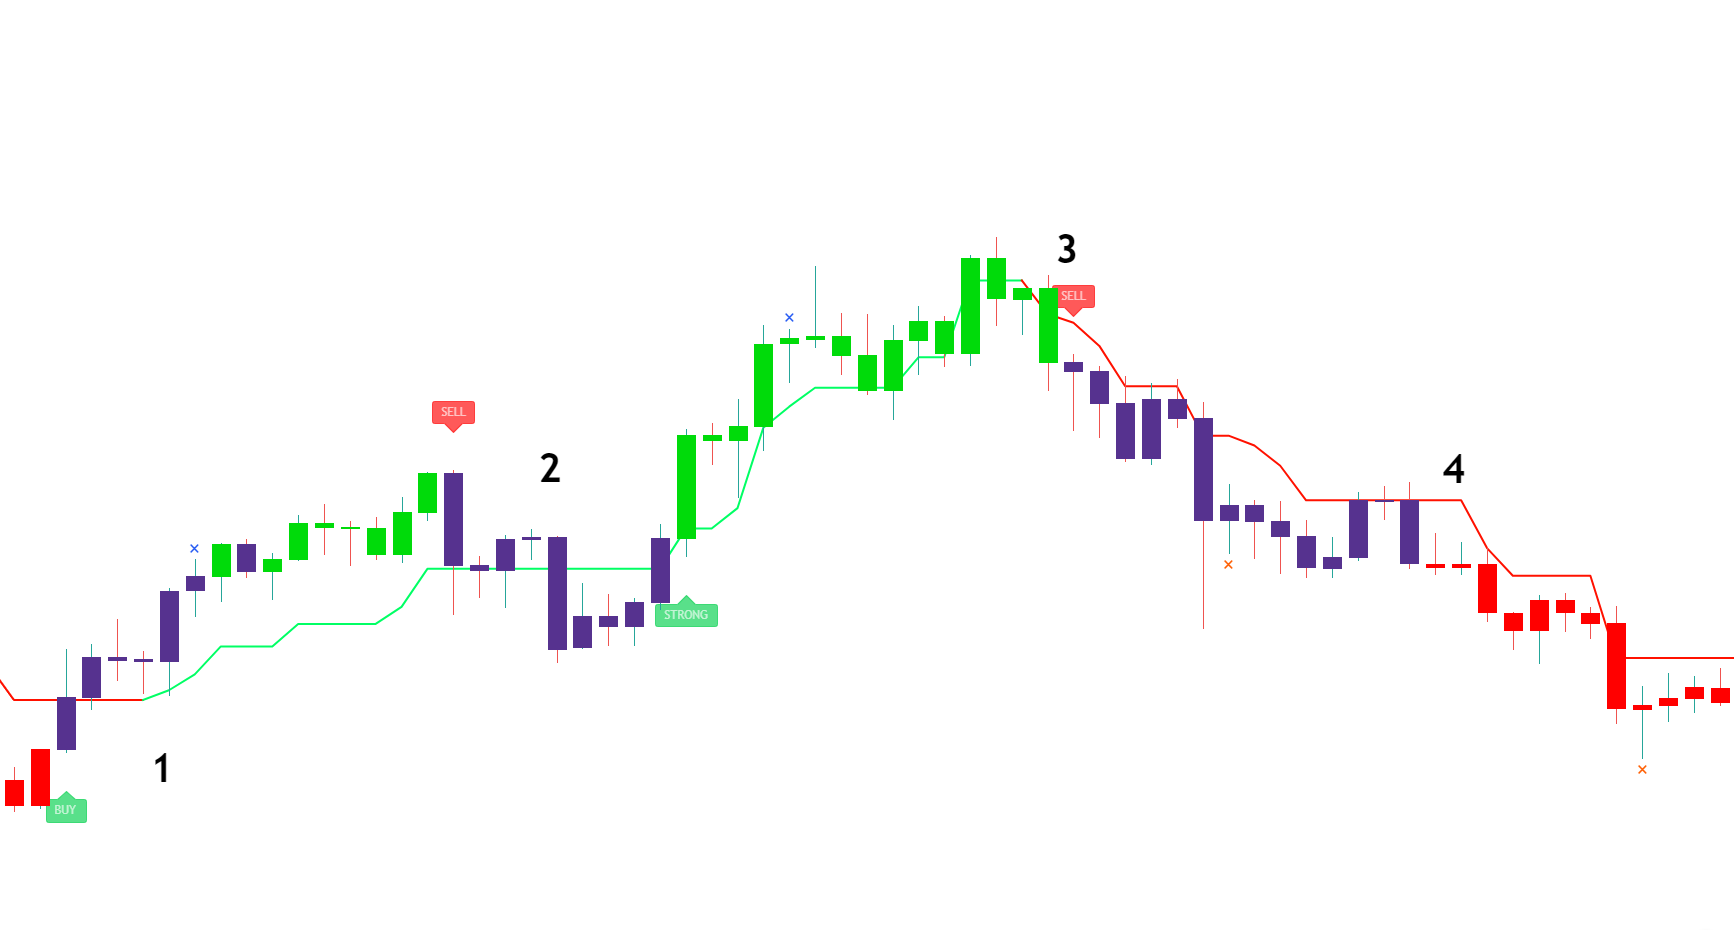
The Trend Catcher is found within Lux Algo’s overlay features. It is most commonly used for a hybrid between classical trend following and predictive nature. This can be a fantastic accompaniment to confirmation signals.
At location 1 we see a buy signal and the Trend Catcher turns green. This suggests the price is going to begin an upward trend. We then see the price move up.
At location 2 we see a sell signal. However it’s important to notice this sell signal is not a strong one and the Trend Catcher is also still green. The Trend Catcher and confirmation signal are not in agreement here making it a less likely trade to take.
At location 3 we see the Trend Catcher turn red at the top of the Trend and predict the market reversal. We then see a sell signal and the market reverses making this a great short/sell opportunity.
At location 4 we see the candles turn red. This shows the normal sell signal has turned into a strong sell signal.This gives us even more confidence in our earlier short position.
Candle Coloring Strategy
Lux Algo provides confirmation classic candle colouring by default. This can be excellent when trading trends and identifying market sentiment.
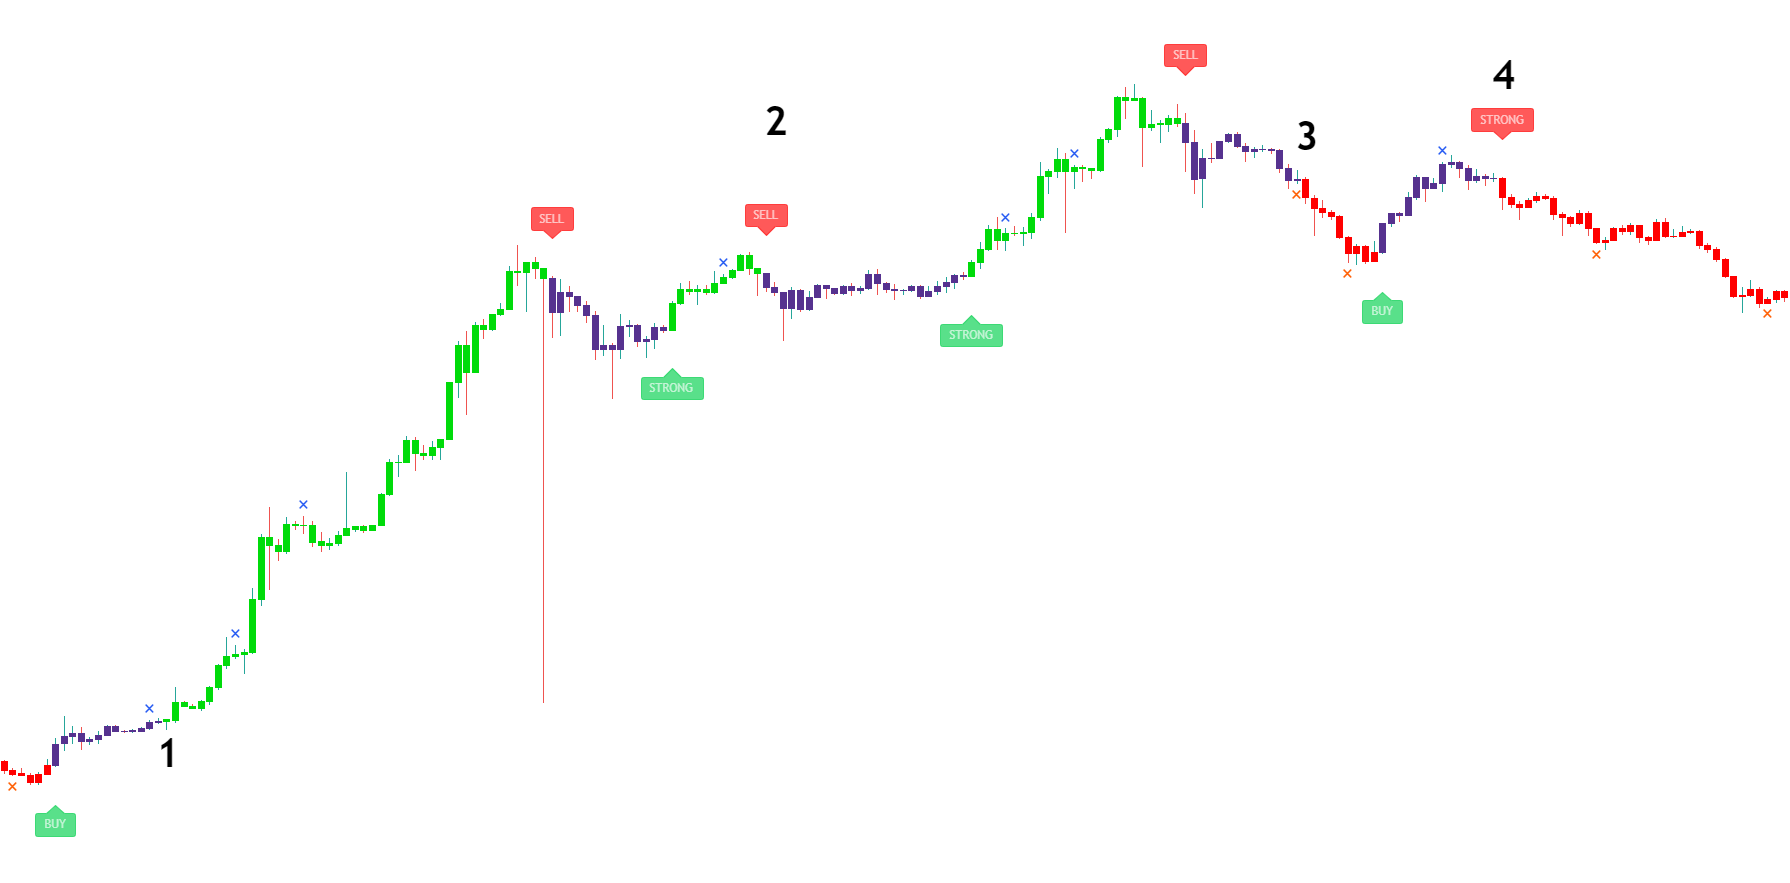
Prior to point 1 in the figure above we see a normal buy signal. However, soon after this buy signal we see the candles turning green. This indicates that the normal buy signal has turned strong and the market is in a strong uptrend. This provides the trader with further confidence a buy/long position is the correct one.
At point 2 we see a normal sell signal. However it’s important to note that the candles here are purple. Purple candles suggest an unconfirmed trend or a ranging market making this trade slightly more risky and suggests this is a retracement as a part of a larger move.
At point 3 we see a normal sell signal turn red. These red candles indicate a strong downtrend.
At point 4 we see a direct strong sell signal. This is a sell signal that occurs with red candles meaning the trend is already a heavy downwards one. This means the trader is trading with the trend.
More Strategies
You can find more detailed strategy videos in the playlist below: