Trend Indicators

Trend indicators aim to return information regarding the underlying trend in the price, with some trend indicators directly trying to estimate the trend component, and others aiming to give information about its direction. Most trend indicators are lagging indicators and are most of the time plotted directly to the price chart.
Moving Averages
Moving averages are lagging trend indicators commonly used to smooth the closing price by removing or attenuating certain variations from it, and are able to estimate the underlying trend in the price. In technical analysis moving averages are ubiquitous to traders, and can be found in every technical analysis software.
Moving averages posses one user setting that generally determine the degree of smoothness of the moving average, this setting is often refereed as the moving average "length", "period" or less commonly "window".
Some Moving Averages
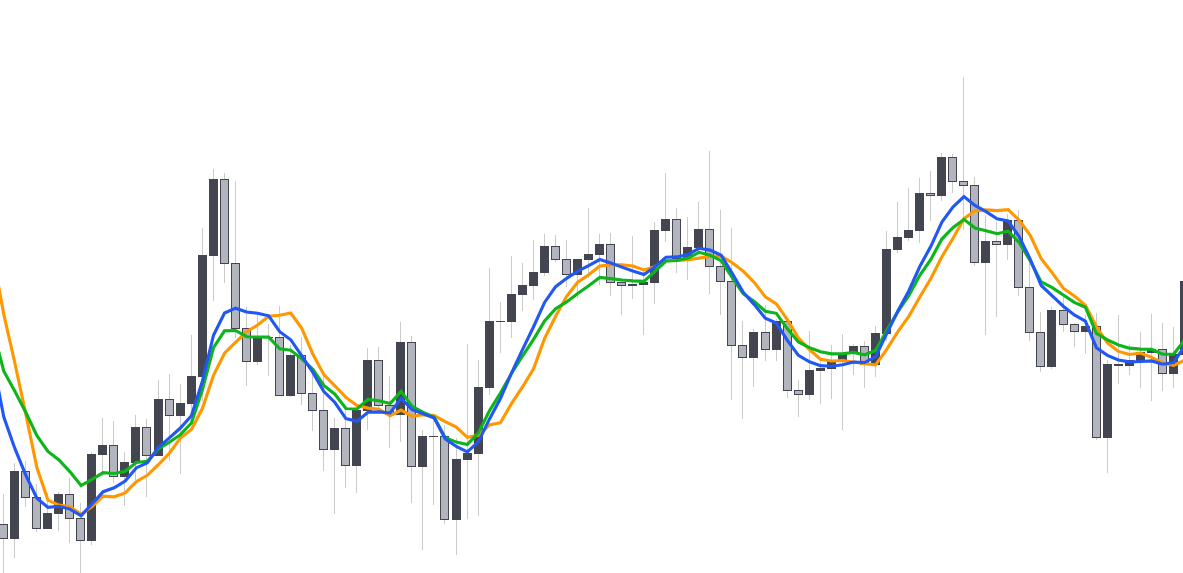
The simple moving average abbreviated "SMA" is certainly the most well known moving average due to its ease of calculation.
Another well known moving average is the exponential moving average (EMA), who has less lag than the SMA.
Finally it is common for some users to use the linearly weighted moving average (WMA), the WMA has less lag than the EMA, this is achieved by giving higher weights to more recent input prices values.
Calculation for each of these moving averages are given below:
- SMA
- EMA
- WMA
where denote the period of the SMA and the closing price.
with , where denote the period of the EMA and the closing price. The EMA is generally initialised using a SMA of the same period.
where denote the period of the WMA and the closing price.
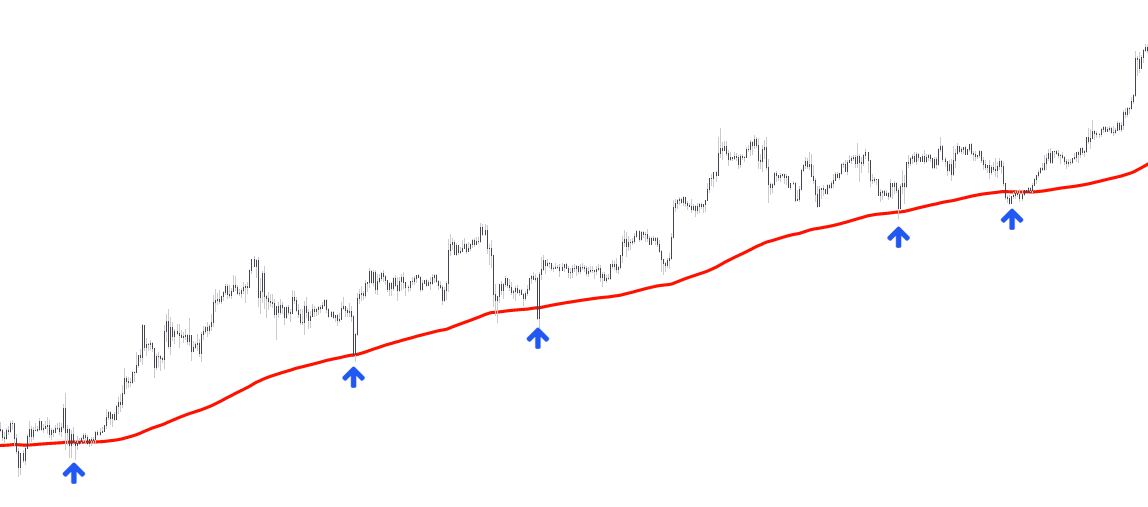
Usages
Moving averages can be used to determine the direction of the current trend in the price by studying crosses made between the price and the moving average, or the crosses made between a short term and a long term moving average.
Moving averages can also be used as a rolling support and resistance, buying when an up-trending price touch the moving average and selling when a down-trending price touch the moving average.
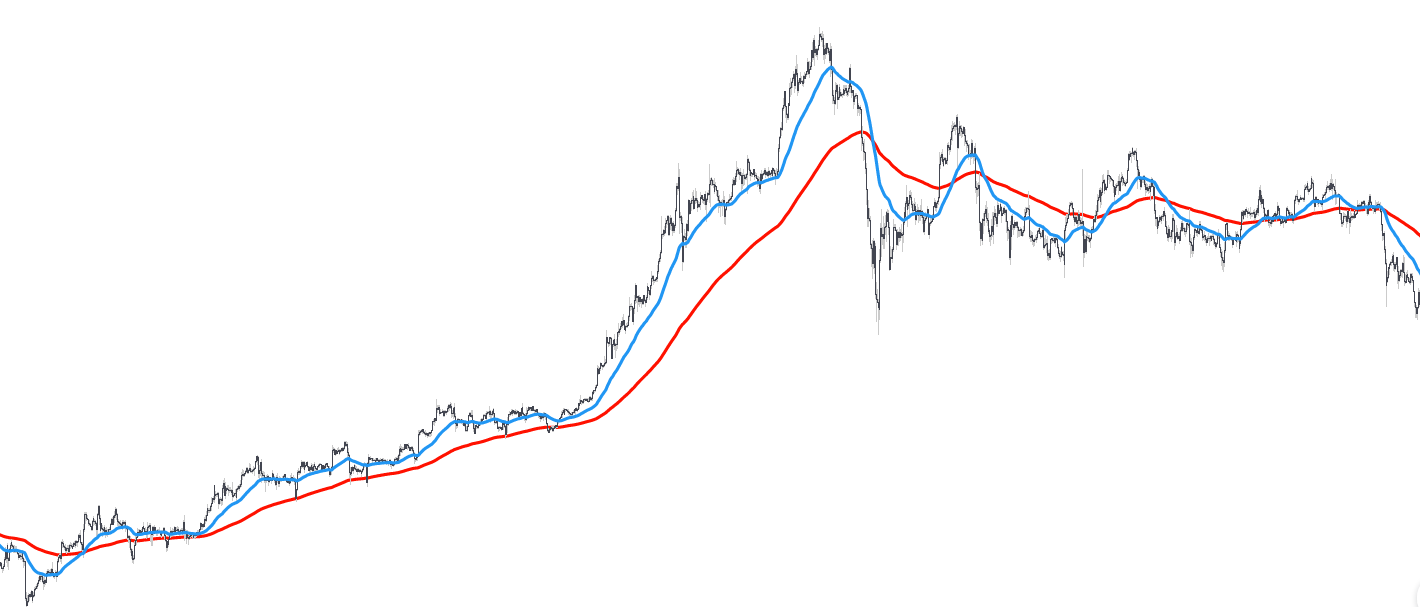
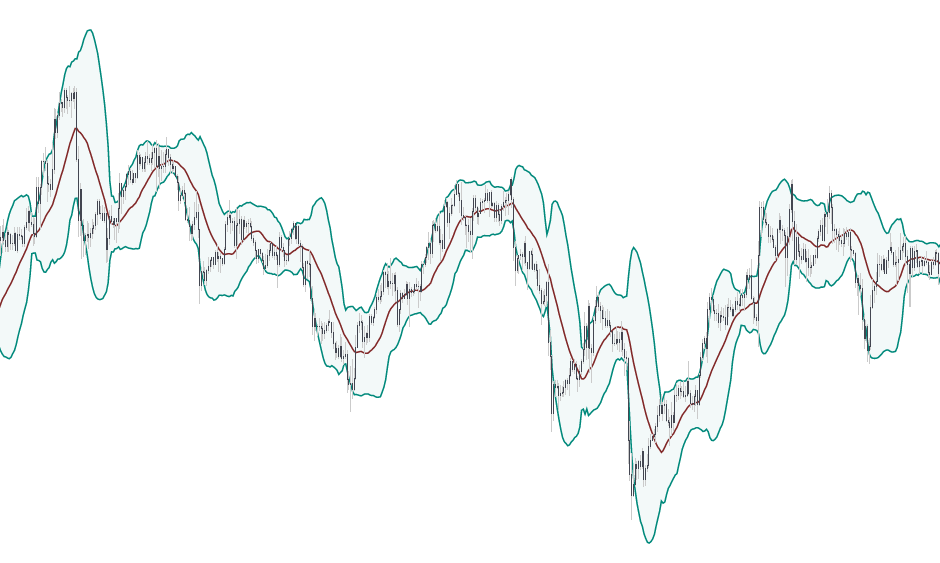
Bands/Channels Indicators
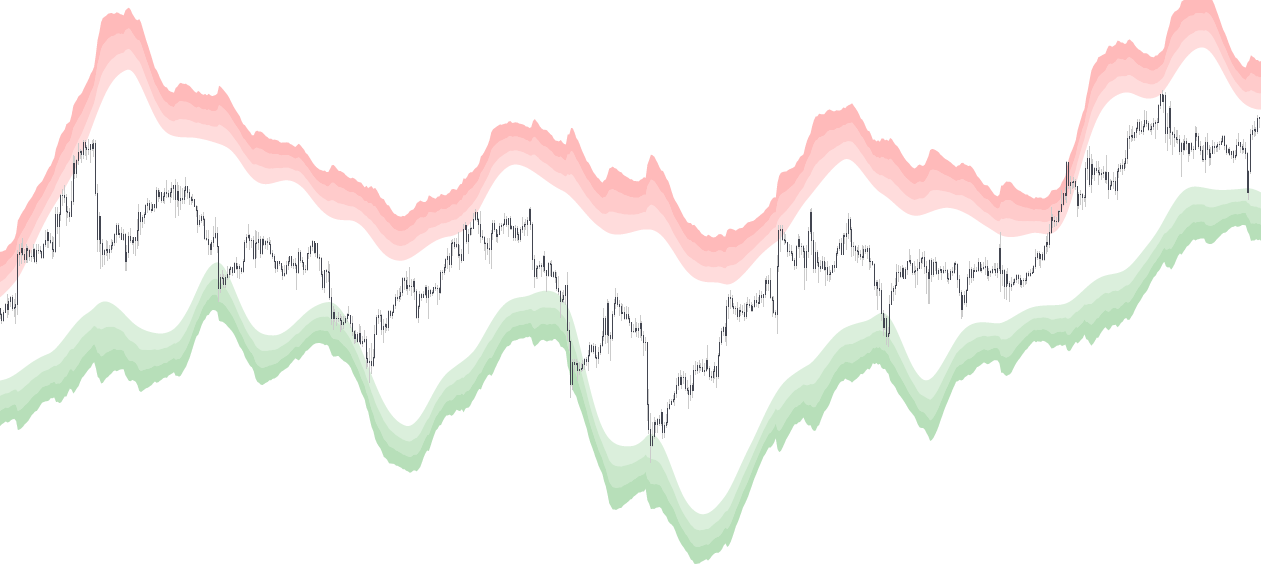
Bands indicators are trend indicators that plot an upper and a lower extremity on the price chart. Bands indicators are often based on moving averages and volatility measurements.
Some Band Indicators
The most well known bands indicators is certainly the Bollinger bands indicator, originally proposed by John Bollinger. The indicator is calculated by adding/subtracting a rolling standard deviation to a simple moving average.
Another commonly use band indicator is the Donchian channel indicator, developed by Richard Donchian. This indicator calculate its upper extremity by using a rolling maximum of the high price and its lower extremity by using a rolling minimum of the low price.

Usage
The upper and lower extremities plotted by bands indicators can be used as support and resistances, the accuracy of the extremities as support and resistances tend to work better during ranging markets.
Bands indicators can also be used to determine the current trend direction by using a breakout methodology, where price is said to be up-trending when price cross over the upper extremity and down-trending when the price cross under the lower extremity.

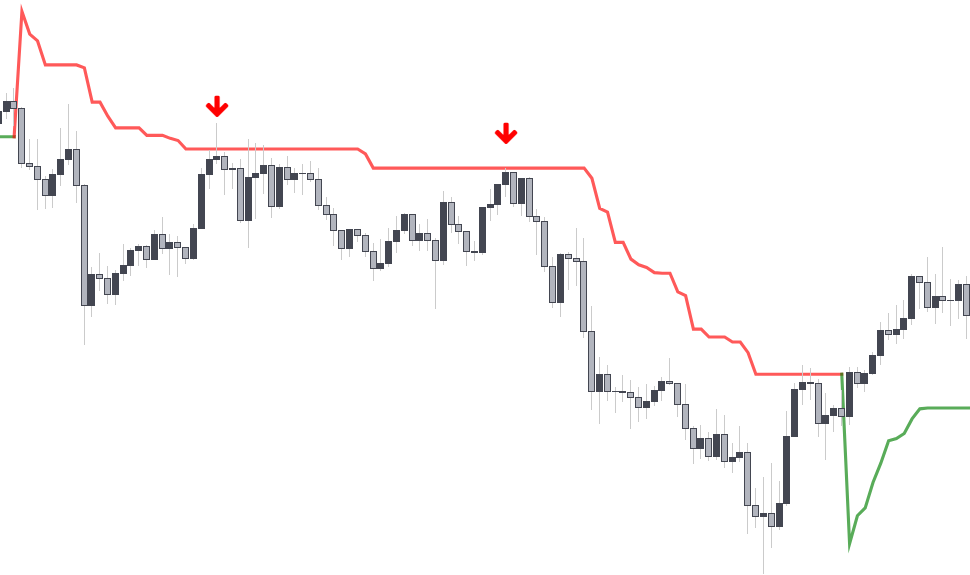
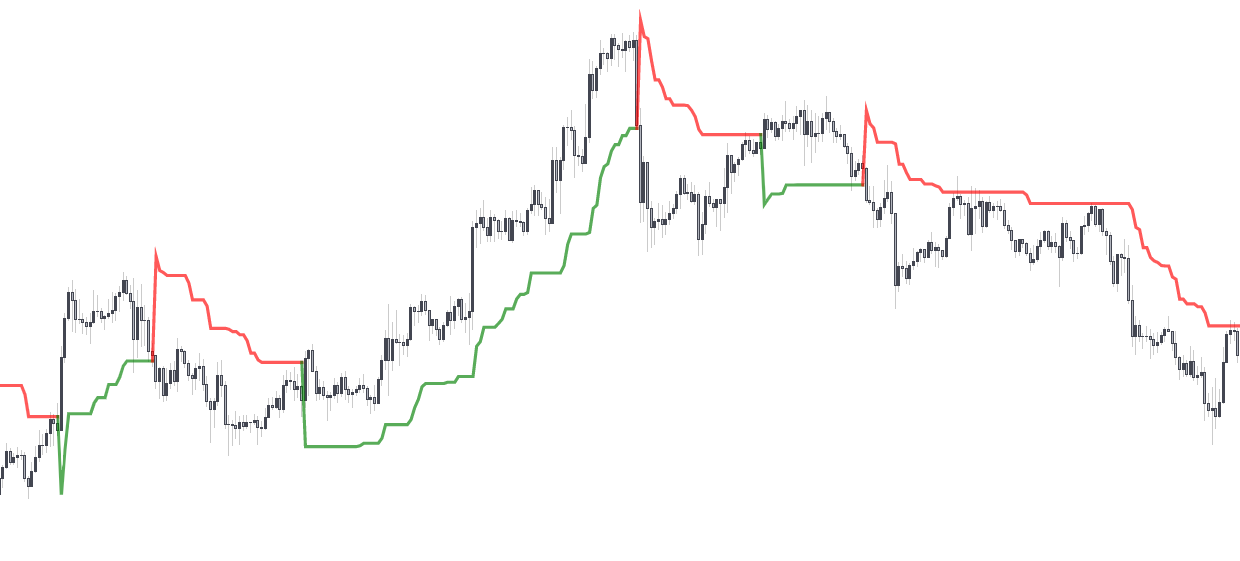
Trailing Stops
Trailing stops are extremely useful to determine the current price trend, they can also be used to set stop losses or as rolling support/resistances.
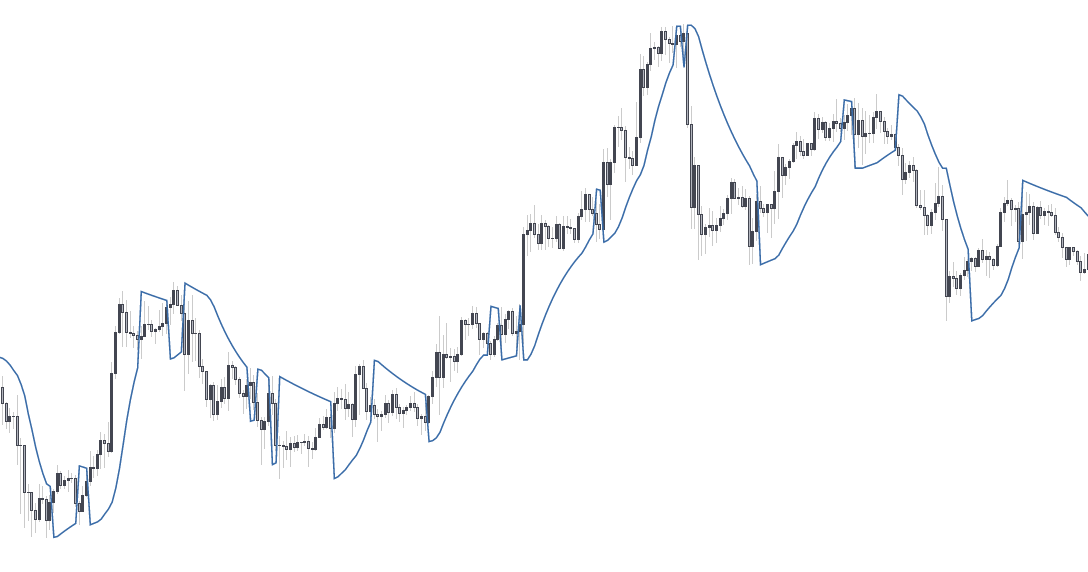
Some Trailing Stops
There exists a wide variety of trailing stops, the most well known certainly being the Supertrend trailing stop, originally developed by Olivier Seban.
Another well known trailing stop is the parabolic stop and reverse, often abbreviated as PSAR or more simply SAR - originally developed by Wells Wilder.
Usage
Trailing stops are generally very simple to interpret, with the trailing stop indicating an up-trend when price is above it, and a down-trend when price is below it. Trailing stops can also be used like moving averages as a rolling support and resistance.