Momentum Indicators

Momentum indicators, also called oscillators, are indicators that are often used to remove the trend component in the price, thus focusing more on the cycle component. Most momentum indicators are leading indicators and are plotted on a separate pane.
Some Momentum Indicators
There exists a wide variety of oscillators, each one having different characteristics. The most well-known one certainly being the momentum oscillator, it is also the easiest one to calculate, as it simply consists of subtracting the current closing price with the nth previous closing price, that is: , where is the period of the momentum oscillator.
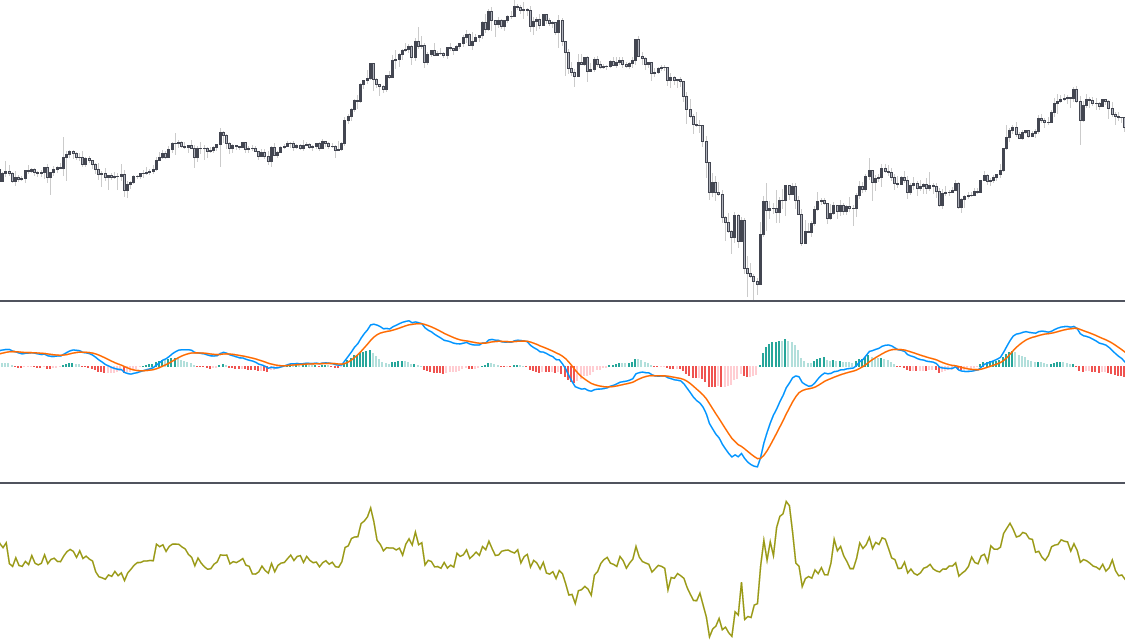
Some momentum indicators are also smooth, this is the case of indicators such as the well known moving average convergence divergence indicator (MACD), or the awesome oscillator, TRIX, center of gravity and many more, their smoothness makes their analysis simpler, however they are subject to lag as a result.
Scale-Invariant Momentum Indicators
Some momentum indicators are scale-invariant, that is, have a fixed scale no matter the original scale of the price, an oscillator is said to be scale-invariant when:
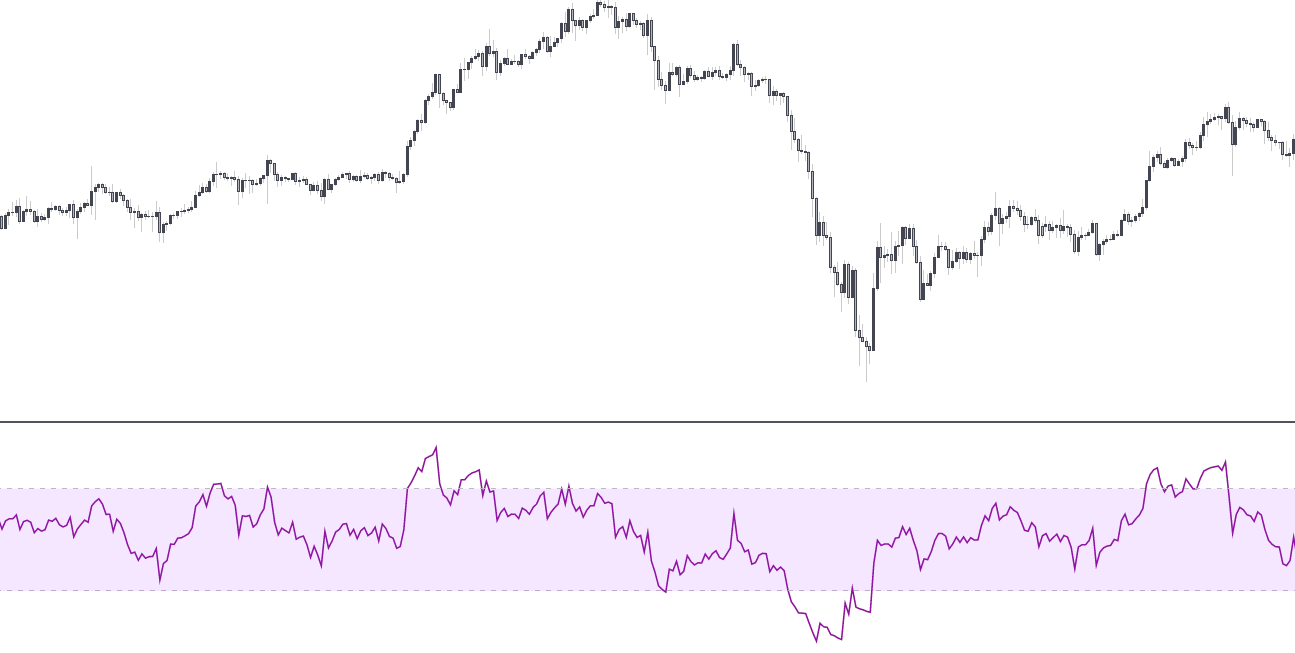
where . These indicators are also said to have a fixed range, or to be normalized. The most famous scale-invariant momentum indicator is certainly the relative strength index (RSI), proposed by Wilder.
Another extremely famous scale-invariant indicator is the stochastic oscillator. Unlike the RSI, the stochastic includes two elements, a %K line, and a %D line, which is simply a smoothed version of the %K.
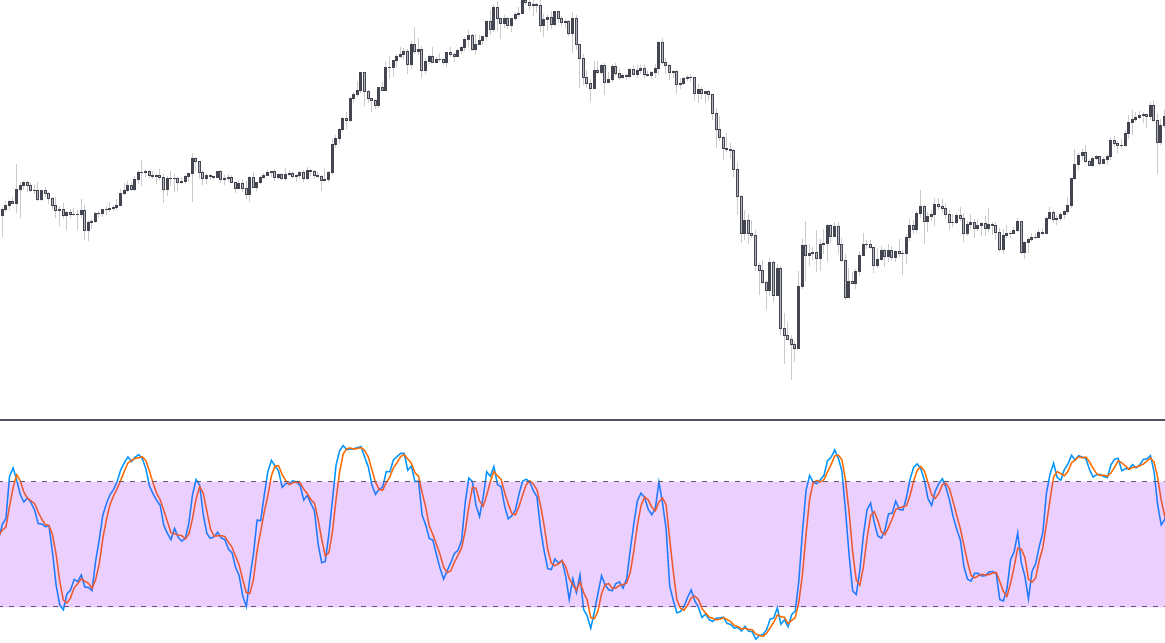
The advantage of scale-invariant momentum indicators is that it is possible to plot fixed levels to them, with the upper level sometimes named overbought level and the lower level named oversold level, these levels can help the trader determine when the market is overbought or oversold.
Other well-known momentum indicators include the commodity channel index (CCI), true strength index (TSI), William %R.
Divergences With Momentum Indicators
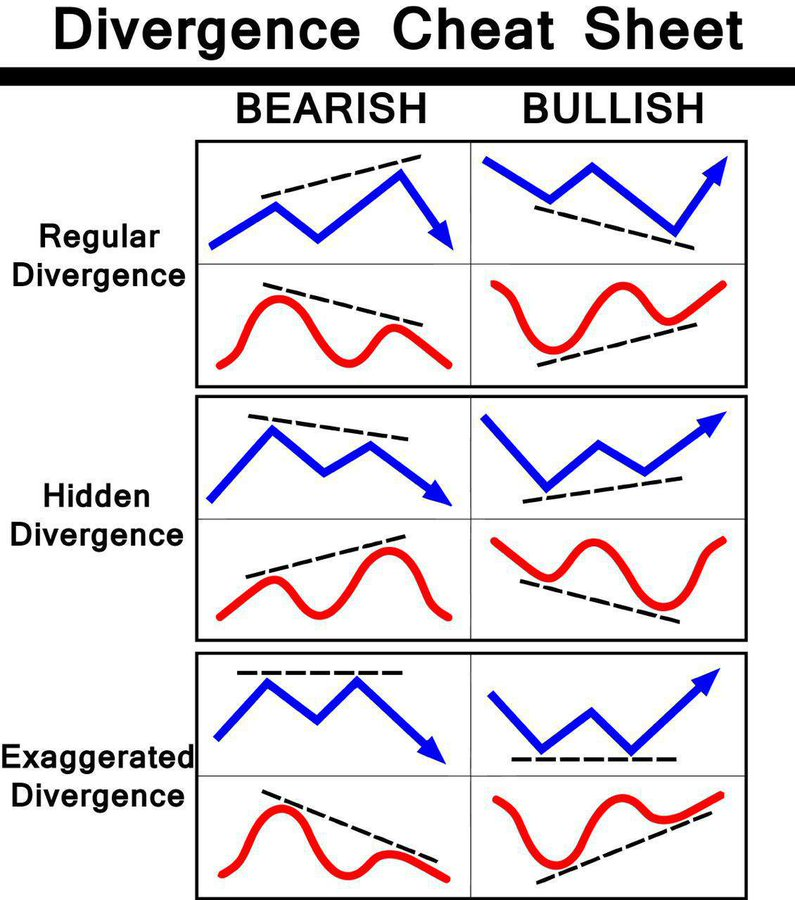
Momentum indicators are used to detect divergences with the price, where a divergence is defined as the price and oscillator moving in opposite directions. The detection of divergences is mostly done by studying the higher high/low and lower high/low made by the price and indicator.