Trading Chart
The most important thing for a technical analysis trader is to see historical market data, this is done by using a trading chart. A trading chart allows to display a variety of information, most commonly market prices, volume and technical indicators.
Below you will find different types of the most commonly used trading charts.
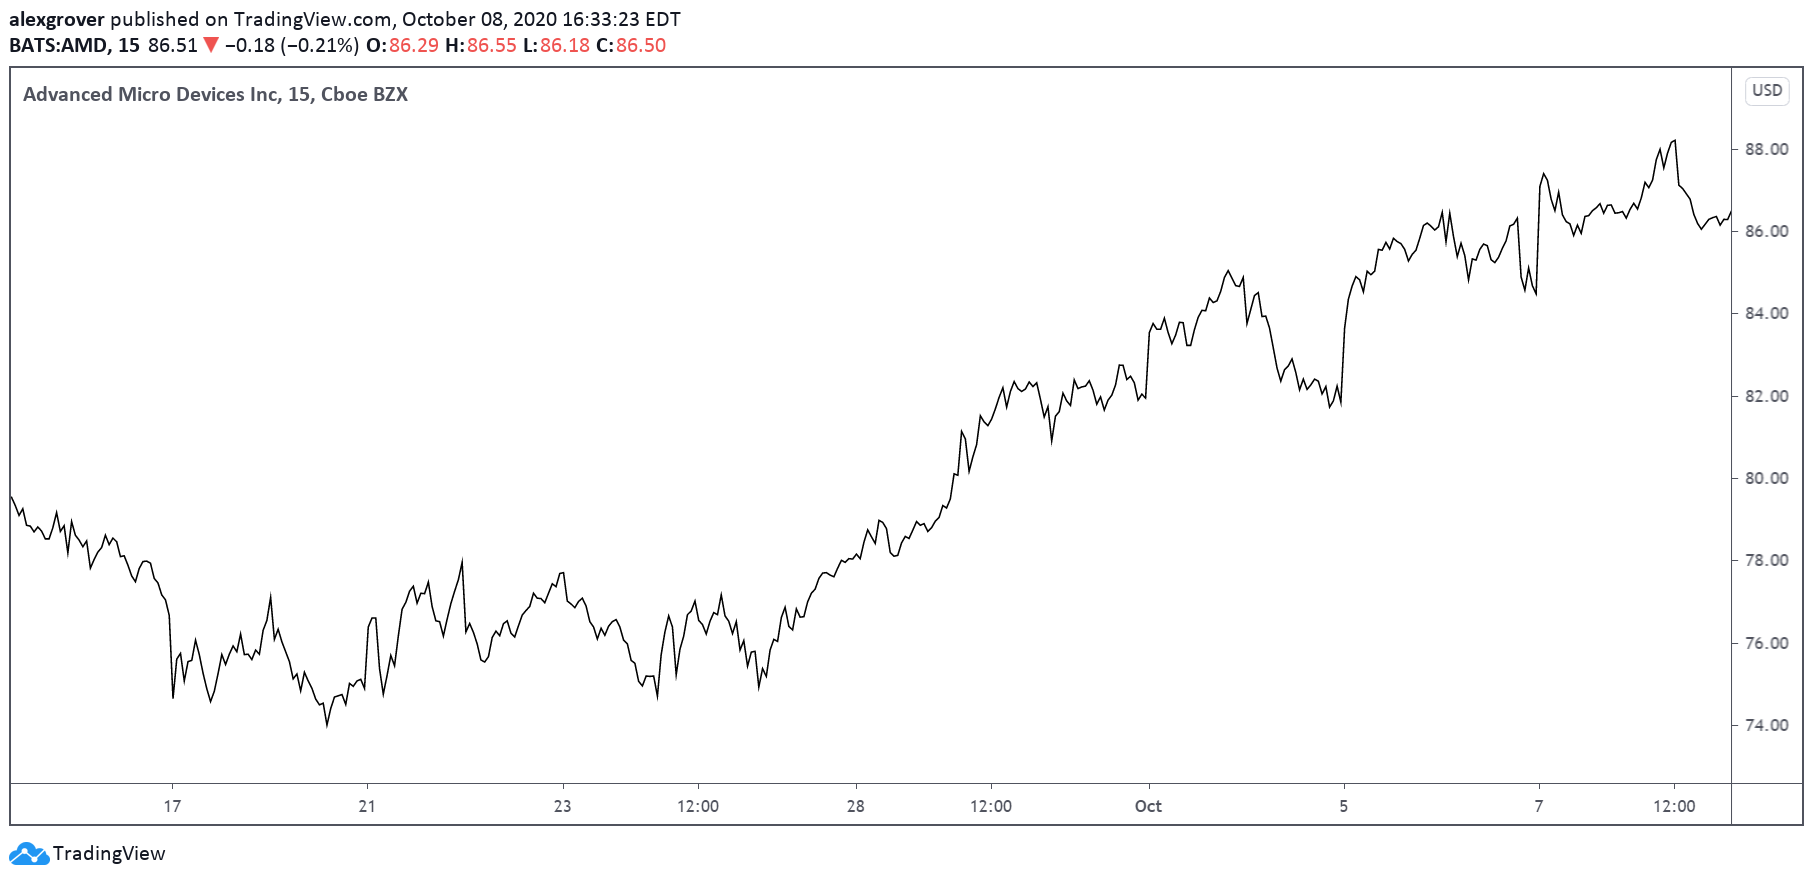
Line Chart
The simplest chart is the line chart, and display closing prices over time as a continuous solid line.
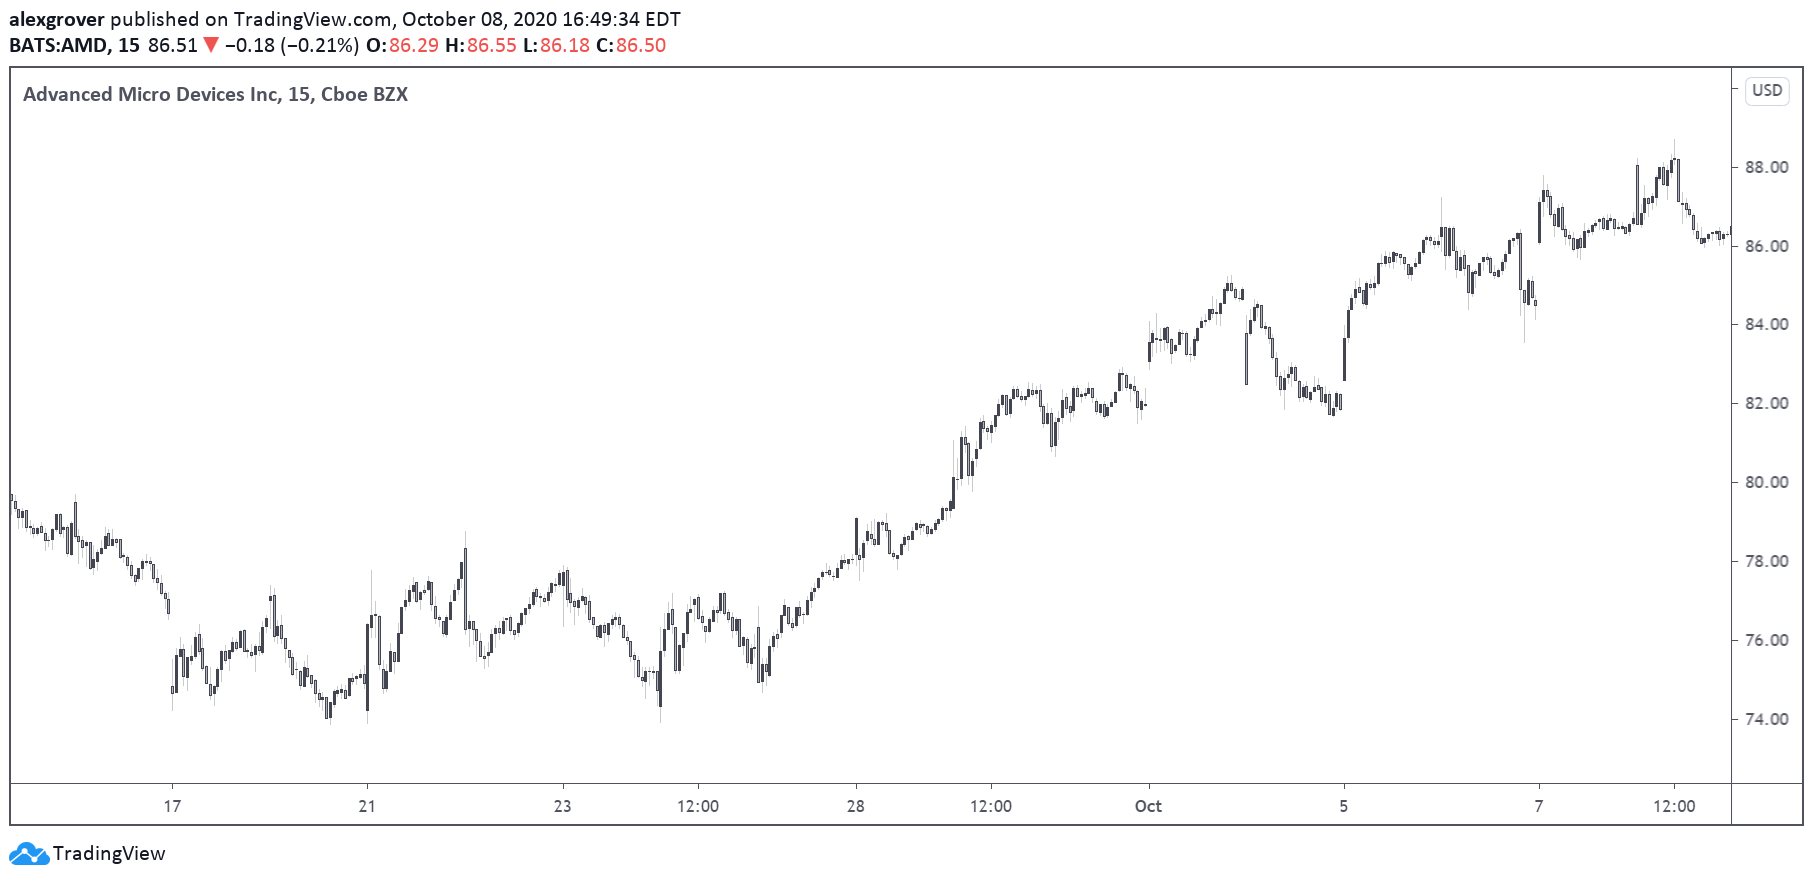
Candlestick Chart
The most common type of charts used by traders are candlesticks charts. Unlike lines charts who generally return a series of closing prices, candlestick charts return as series of candles that allows the trader to access both the opening price, high price, low price, and closing price.
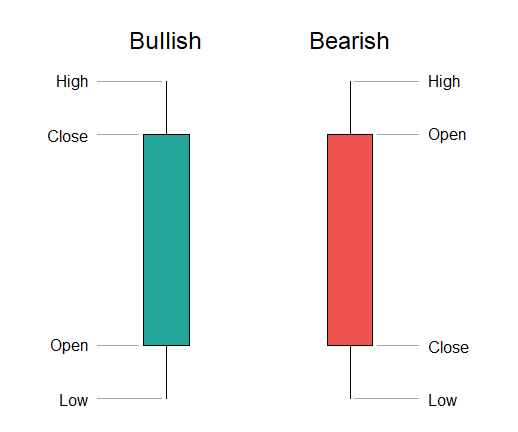
The area between the closing price and opening price is referred as the body of the candle, while the thin lines connecting the high/low price are called wicks or shadows.
When the closing price is higher than the opening price, the candle is said to be bullish, while a bearish candle occurs when the closing price lower than the opening price.
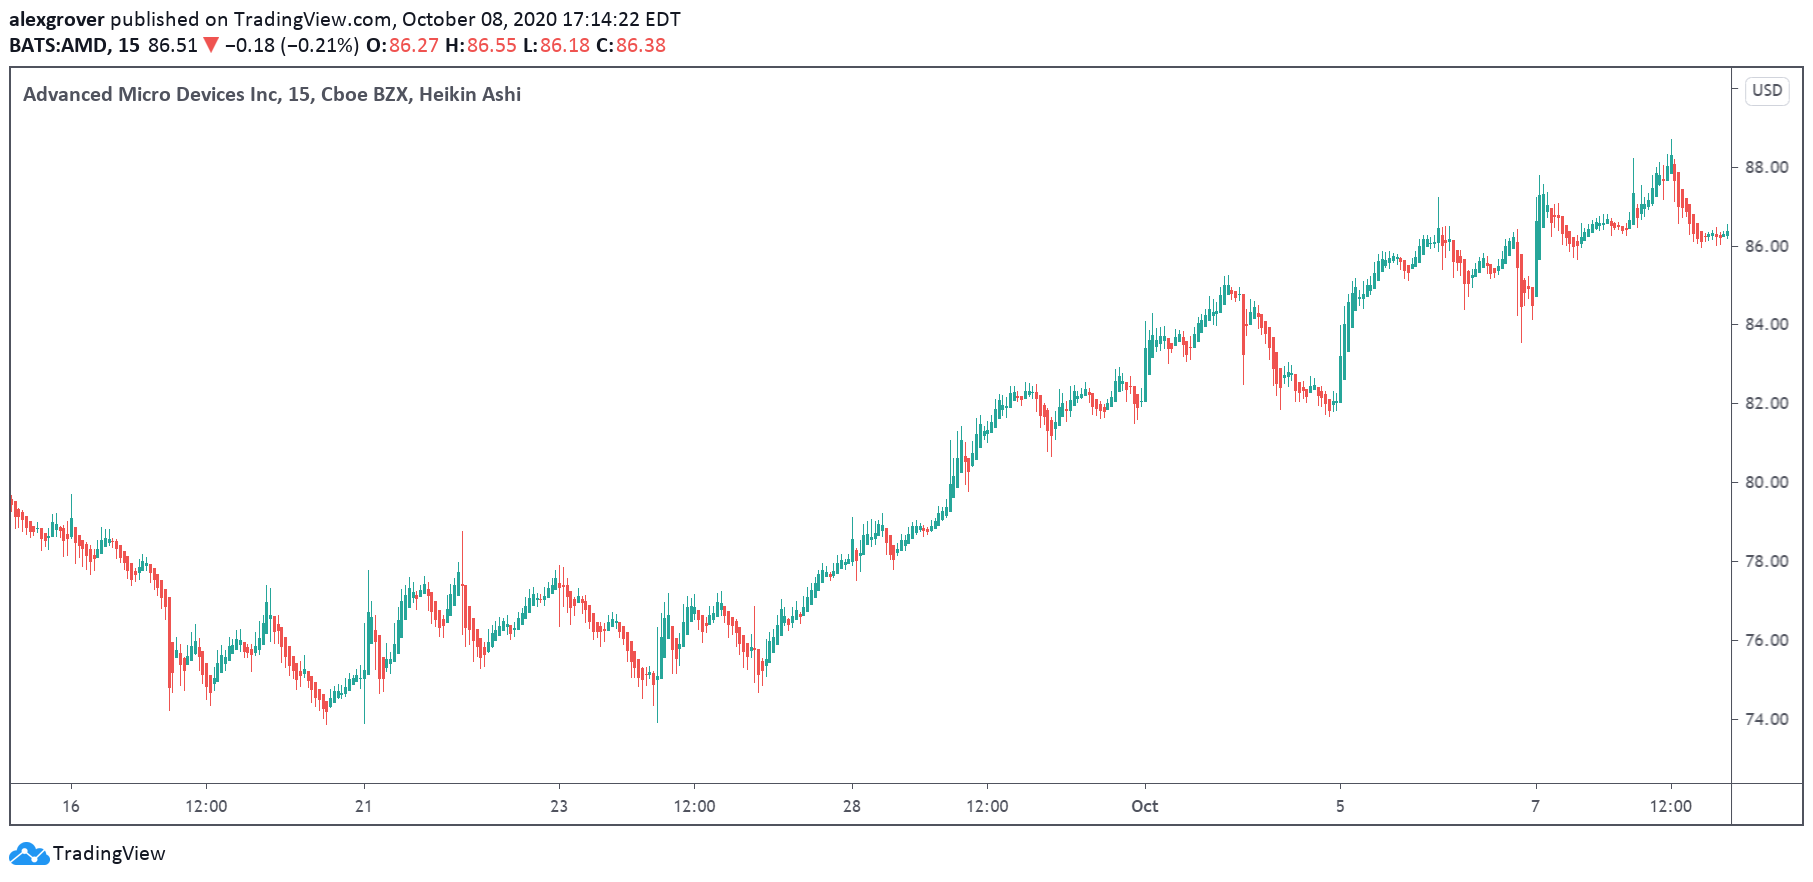
Heikin-Ashi Candlesticks
Heikin-Ashi candlesticks are a smoother variant of traditional candlesticks, removing noisy variations from the price thus being easier to analyze.
warning
Note that heikin-ashi candles do not display true market prices values, you shouldn't backtest any strategy using heikin-ashi as the results would be unrealistic, more information here.
Ohlc values displayed by heikin-ashi candles are determined as follows:
- HA Open
- HA Close
- HA High
- HA Low
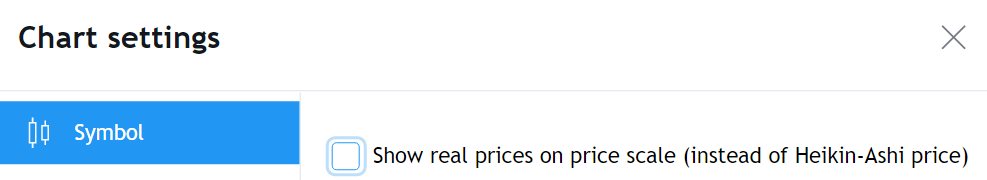
Tradingview allows you to see the true closing and opening price on an heikin-ashi chart by selecting Show real prices on price scale (instead of heikin ashi price) from the chart settings.
Indicators applied to heikin-ashi chart will return fewer false signals due to the smoother nature of heikin-ashi charts.