Candle Settings
Candle Coloring
The candle coloring feature allows the user to change the body color of the candles/bars when using candlesticks or bar charts. Three coloring modes are available, with two of them being based on the previously described signal methodologies.
Candle coloring also works on charts using Heikin-Ashi, Renko, Kagi, line break, point and figure, and range candles.
Each mode can be enabled from the settings in the candle color mode dropdown menu.

In order to use candle coloring as properly as possible make sure to disable the borders setting in your chart settings.
Confirmation Simple
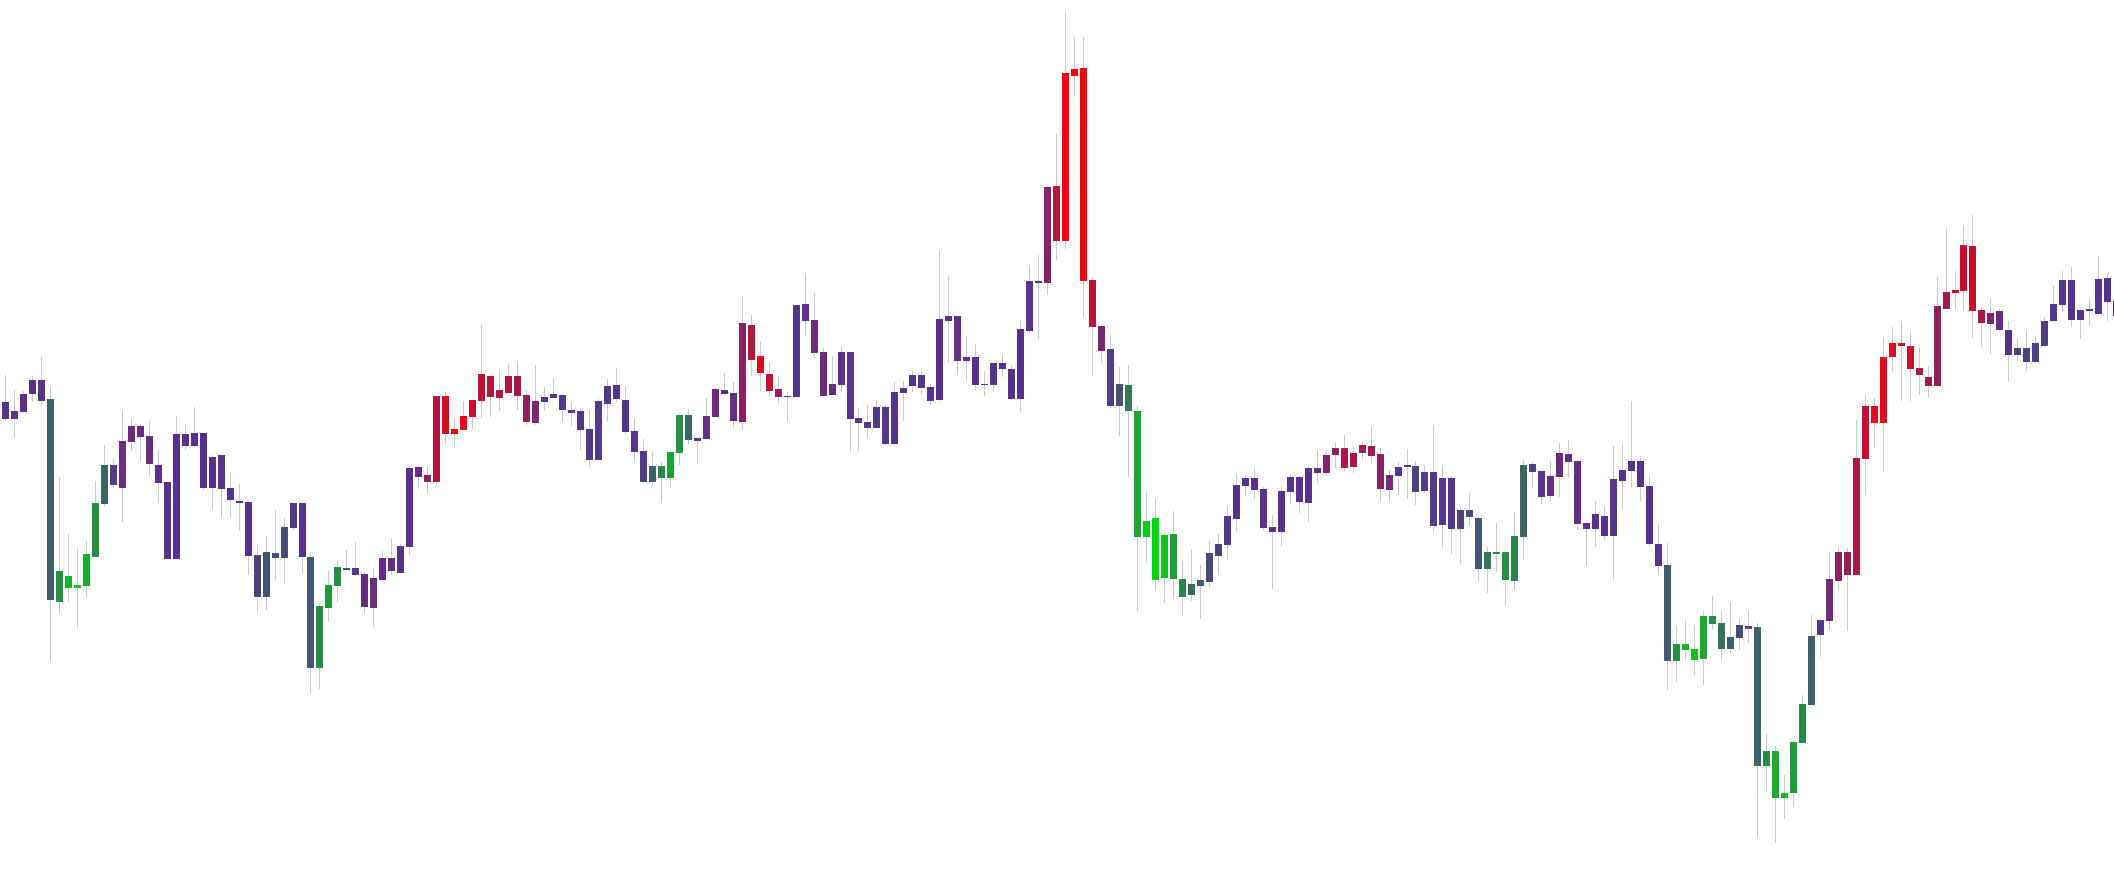
The confirmation simple color mode is based on the methodology used by confirmation signals and is the one enabled by default. This mode uses three colors, each one can be interpreted as follows:
- Green candles: Strong buy active.
- Red candles: Strong sell active.
- Purple candles: Normal buy or sell signal active.
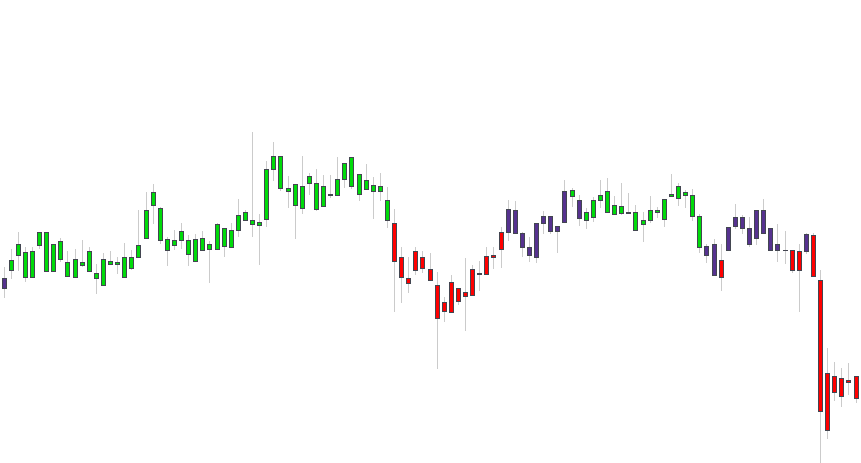
Confirmation Gradient
The confirmation gradient color mode is also based on the algorithm that generates confirmation signals, but will slightly differ from the previously described confirmation simple color mode.
Lighter green colors indicate strong bullish variations, while lighter red colors indicate strong bearish variations. Color closer to purple indicates that the current variation might be a retracement or that the market is ranging.
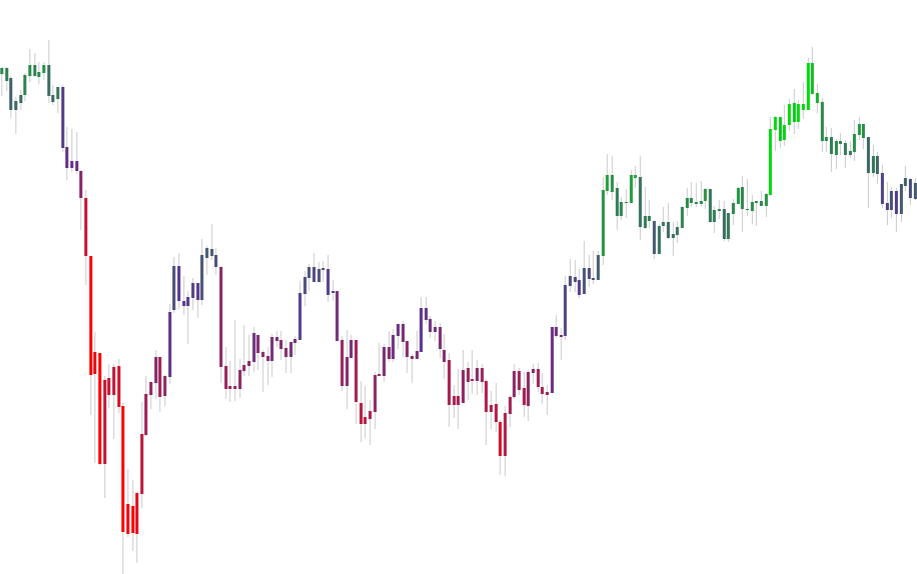
Contrarian gradient
The contrarian gradient color mode is based on the contrarian signals algorithm. Stronger green colors indicate an oversold market and a potential reversal, while stronger red colors indicate an overbought market.