Levels
Levels methods display horizontals supports and resistances on the user chart.
The Levels SR method regroup two methods described below:
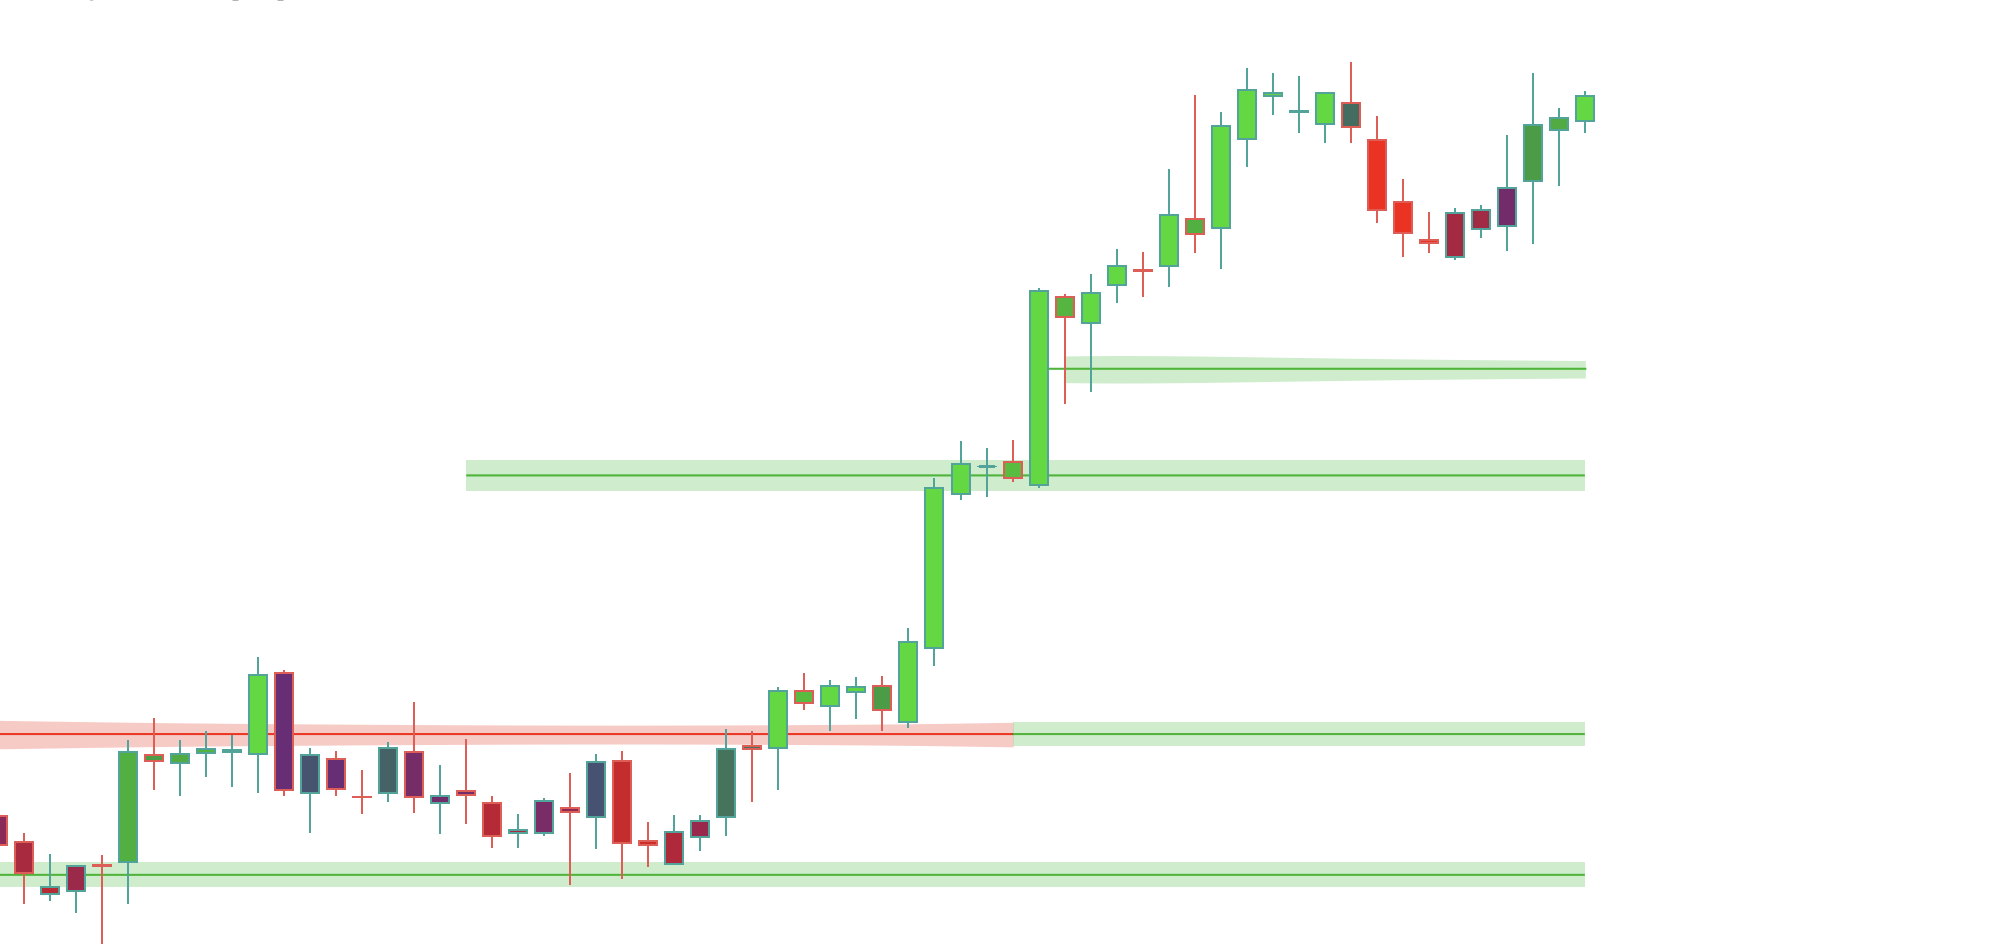
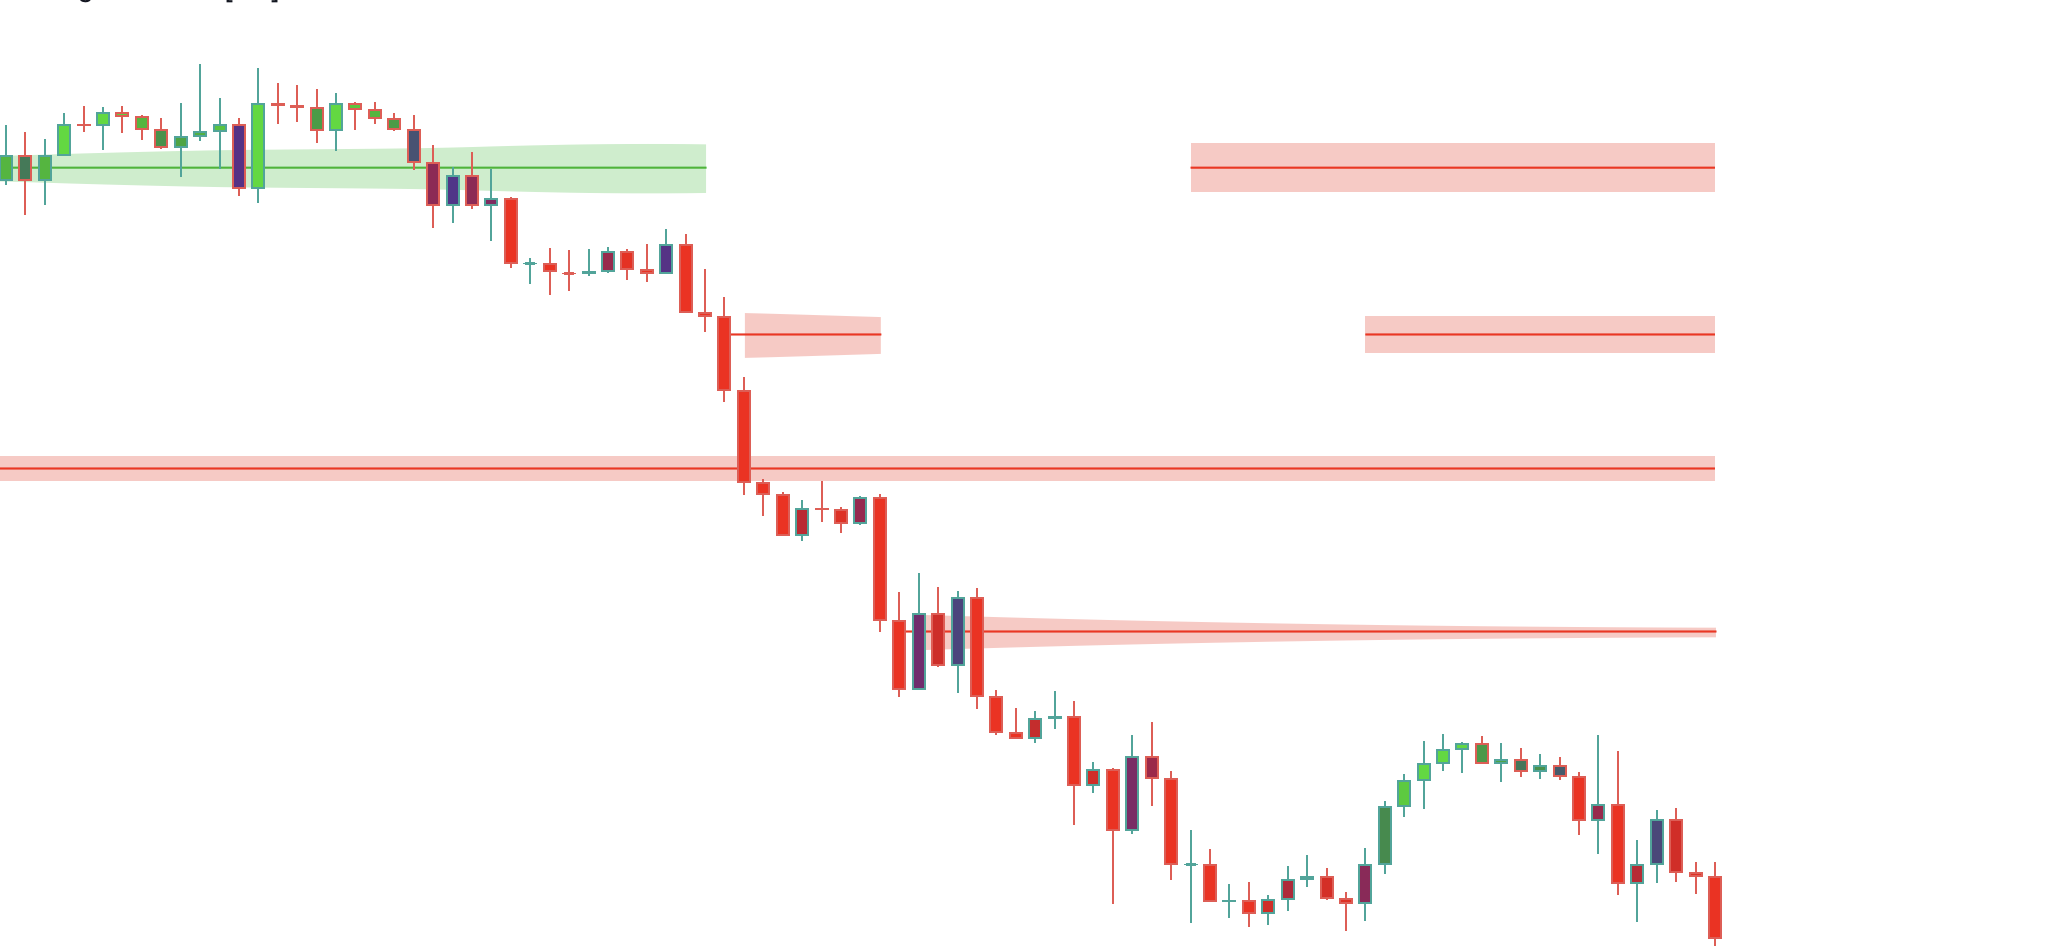
Breakout Zones

The Breakout Zones levels displays real time horizontal support and resistances lines on the chart.
The breakout zones provide dynamic supply and demand areas. These can be used to determine regions in the market to place orders. This feature consists of 2 main zones; the irregular cloud and live supply/demand zones. The clouds will appear in real time and provide a zone where the price may find support/resistance. The cloud will appear green when acting as a support and red when acting as a resistance.
The live supply demand zones appear 25 bars after the cloud appears and provide real time areas of supply and demand in the market. A trader may wish to use these levels to identify breakouts of market structures or price action.
Liquid Pivots
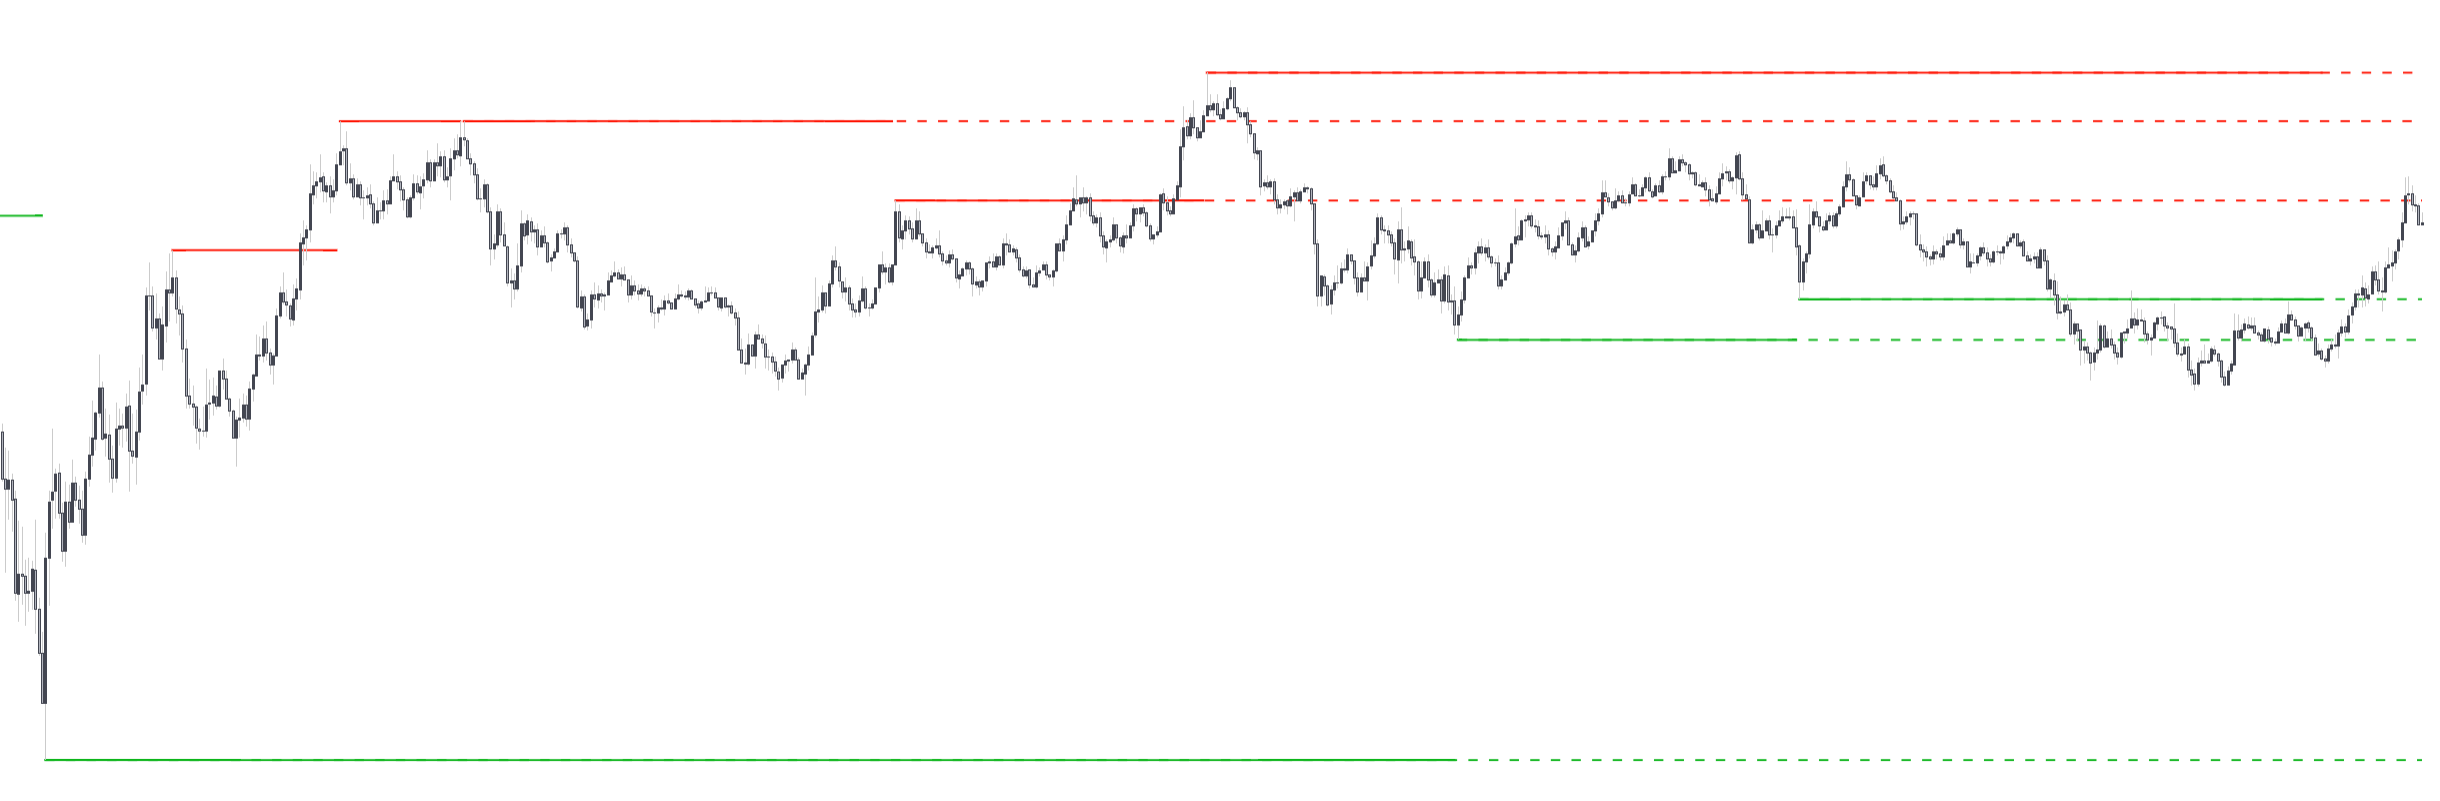
The Liquid Pivots method displays historical pivot levels that occured during periods of high volume. These can be considered more significant when providing support and resistance levels and during breakouts.
The most recent three pivot highs and lows are extended to the most recent bar.