Pivot Oscillator
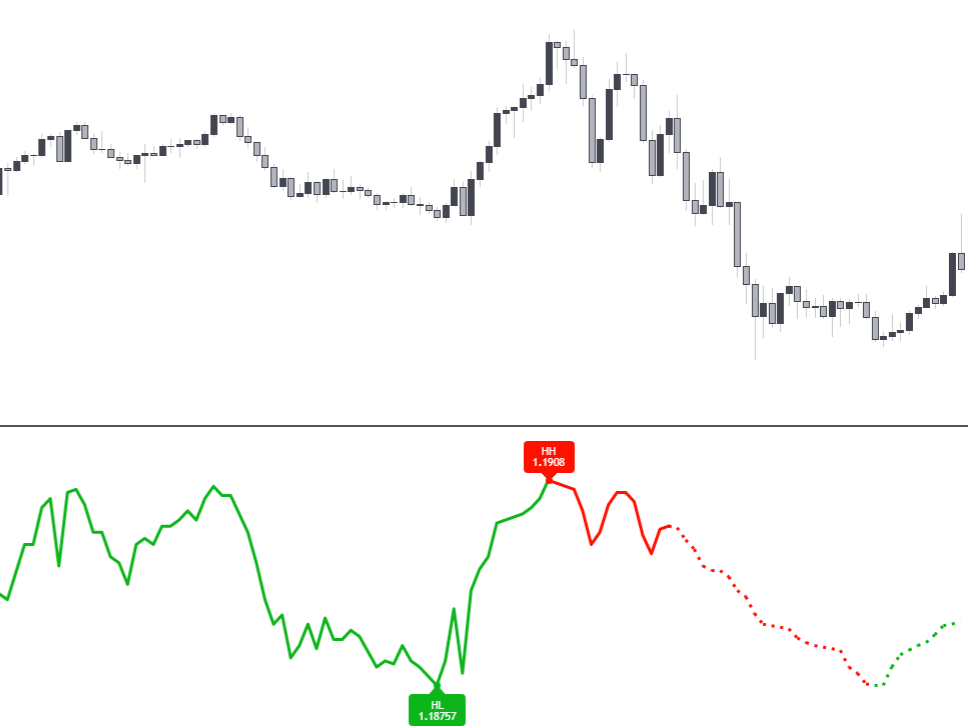
The pivot oscillator is a pivot-related indicator that displays the percentage of prices lower or equal to a price of reference over a fixed window length. Pivot-highs occur when the indicator is equal to 100%, while pivot-lows occur when the indicator is equal to 0%.
When a pivot-high is detected the indicator displays a red label with the high price value, a green label is displayed with the low price value is displayed when a pivot-low is detected.
warning
The non-dotted line and labels are offset by Length bars. They do not appear in real-time. The indicator and its forecast should never be used alone, but only to support an existing analysis.
Usage

The main usage of the indicator is found with its forecast (displayed as dotted lines). This forecast allows forecasting the position of potential tops and bottoms. This makes this precise indicator a contrarian tool rather than a trend-following indicator.
caution
Note that forecasts are subject to repainting.
When we have signs of a reversal by multiple indicators it can be interesting to see this indicator to see if the forecast supports the hypothesis of a reversal.
info
Due to the nature of the forecast, It can be more effective to use lower Length settings.